Trinidadian and Tobagonian vs Immigrants from Latvia Unemployment Among Ages 65 to 74 years
COMPARE
Trinidadian and Tobagonian
Immigrants from Latvia
Unemployment Among Ages 65 to 74 years
Unemployment Among Ages 65 to 74 years Comparison
Trinidadians and Tobagonians
Immigrants from Latvia
5.6%
UNEMPLOYMENT AMONG AGES 65 TO 74 YEARS
0.8/ 100
METRIC RATING
249th/ 347
METRIC RANK
5.3%
UNEMPLOYMENT AMONG AGES 65 TO 74 YEARS
74.6/ 100
METRIC RATING
147th/ 347
METRIC RANK
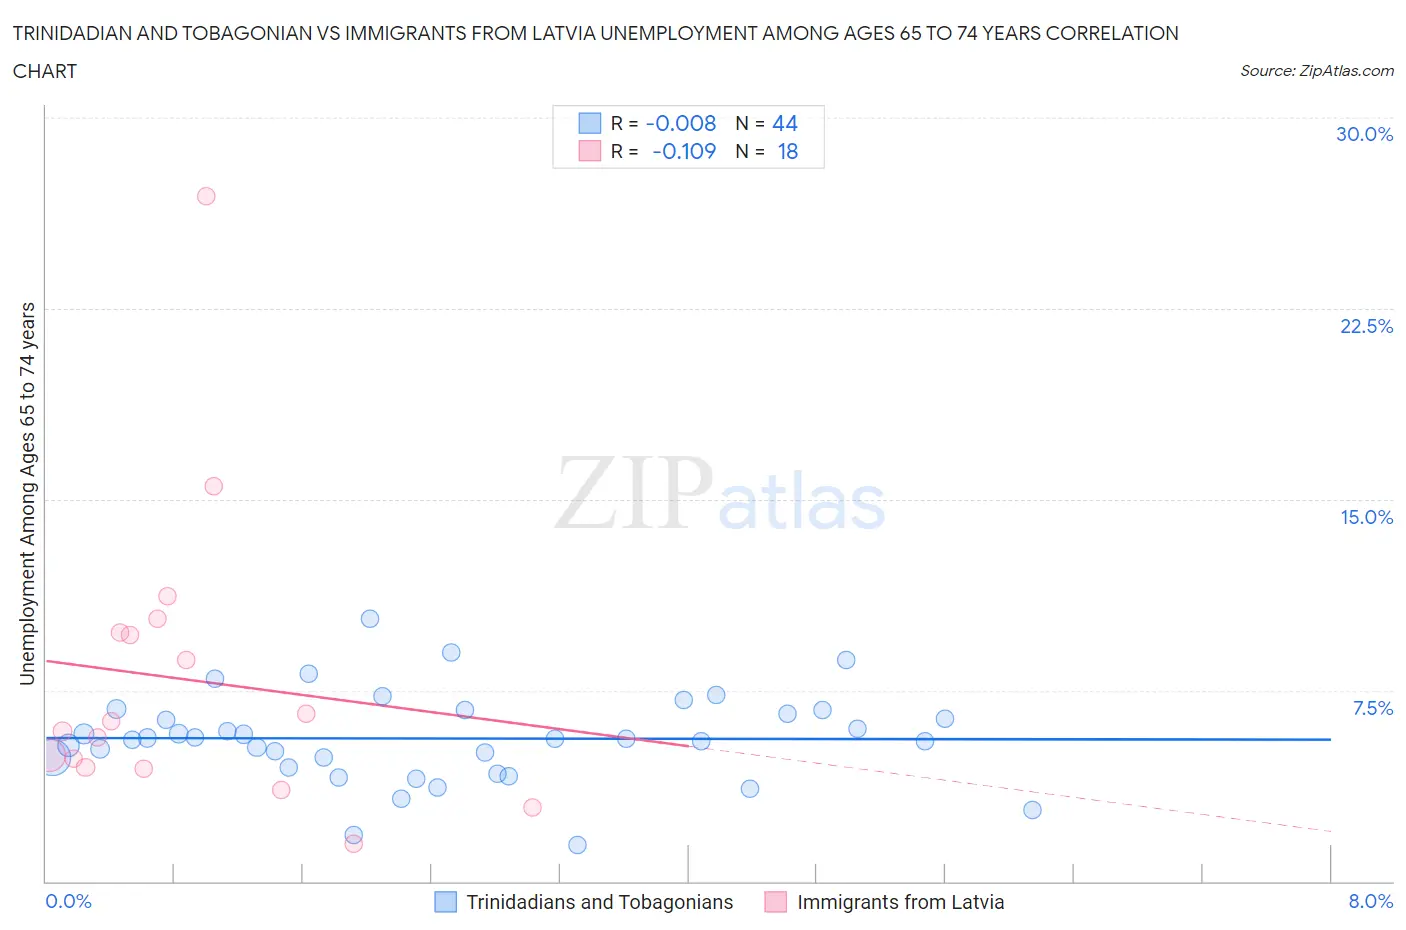
Trinidadian and Tobagonian vs Immigrants from Latvia Unemployment Among Ages 65 to 74 years Correlation Chart
The statistical analysis conducted on geographies consisting of 204,784,447 people shows no correlation between the proportion of Trinidadians and Tobagonians and unemployment rate among population between the ages 65 and 74 in the United States with a correlation coefficient (R) of -0.008 and weighted average of 5.6%. Similarly, the statistical analysis conducted on geographies consisting of 108,700,333 people shows a poor negative correlation between the proportion of Immigrants from Latvia and unemployment rate among population between the ages 65 and 74 in the United States with a correlation coefficient (R) of -0.109 and weighted average of 5.3%, a difference of 5.0%.
Unemployment Among Ages 65 to 74 years Correlation Summary
| Measurement | Trinidadian and Tobagonian | Immigrants from Latvia |
| Minimum | 1.4% | 1.5% |
| Maximum | 10.3% | 26.9% |
| Range | 8.9% | 25.4% |
| Mean | 5.6% | 7.9% |
| Median | 5.6% | 6.1% |
| Interquartile 25% (IQ1) | 4.7% | 4.5% |
| Interquartile 75% (IQ3) | 6.7% | 9.8% |
| Interquartile Range (IQR) | 2.0% | 5.3% |
| Standard Deviation (Sample) | 1.8% | 5.9% |
| Standard Deviation (Population) | 1.7% | 5.7% |
Similar Demographics by Unemployment Among Ages 65 to 74 years
Demographics Similar to Trinidadians and Tobagonians by Unemployment Among Ages 65 to 74 years
In terms of unemployment among ages 65 to 74 years, the demographic groups most similar to Trinidadians and Tobagonians are Immigrants (5.6%, a difference of 0.060%), Immigrants from Argentina (5.6%, a difference of 0.060%), Cape Verdean (5.6%, a difference of 0.080%), Immigrants from Greece (5.6%, a difference of 0.12%), and Paraguayan (5.6%, a difference of 0.12%).
| Demographics | Rating | Rank | Unemployment Among Ages 65 to 74 years |
| Immigrants | Ghana | 1.4 /100 | #242 | Tragic 5.6% |
| Immigrants | Peru | 1.3 /100 | #243 | Tragic 5.6% |
| Immigrants | Micronesia | 0.9 /100 | #244 | Tragic 5.6% |
| Immigrants | Greece | 0.9 /100 | #245 | Tragic 5.6% |
| Paraguayans | 0.9 /100 | #246 | Tragic 5.6% |
| Immigrants | Immigrants | 0.9 /100 | #247 | Tragic 5.6% |
| Immigrants | Argentina | 0.9 /100 | #248 | Tragic 5.6% |
| Trinidadians and Tobagonians | 0.8 /100 | #249 | Tragic 5.6% |
| Cape Verdeans | 0.7 /100 | #250 | Tragic 5.6% |
| Brazilians | 0.5 /100 | #251 | Tragic 5.6% |
| Colombians | 0.5 /100 | #252 | Tragic 5.6% |
| Immigrants | Brazil | 0.5 /100 | #253 | Tragic 5.6% |
| Immigrants | Costa Rica | 0.5 /100 | #254 | Tragic 5.6% |
| Immigrants | Haiti | 0.4 /100 | #255 | Tragic 5.6% |
| Native Hawaiians | 0.4 /100 | #256 | Tragic 5.6% |
Demographics Similar to Immigrants from Latvia by Unemployment Among Ages 65 to 74 years
In terms of unemployment among ages 65 to 74 years, the demographic groups most similar to Immigrants from Latvia are Irish (5.3%, a difference of 0.010%), Canadian (5.3%, a difference of 0.020%), Immigrants from Sri Lanka (5.3%, a difference of 0.040%), Immigrants from Romania (5.3%, a difference of 0.050%), and Immigrants from Poland (5.3%, a difference of 0.060%).
| Demographics | Rating | Rank | Unemployment Among Ages 65 to 74 years |
| Immigrants | Laos | 78.6 /100 | #140 | Good 5.3% |
| Immigrants | Asia | 78.4 /100 | #141 | Good 5.3% |
| Turks | 76.2 /100 | #142 | Good 5.3% |
| New Zealanders | 76.1 /100 | #143 | Good 5.3% |
| Immigrants | Chile | 76.0 /100 | #144 | Good 5.3% |
| Canadians | 75.0 /100 | #145 | Good 5.3% |
| Irish | 74.8 /100 | #146 | Good 5.3% |
| Immigrants | Latvia | 74.6 /100 | #147 | Good 5.3% |
| Immigrants | Sri Lanka | 73.8 /100 | #148 | Good 5.3% |
| Immigrants | Romania | 73.5 /100 | #149 | Good 5.3% |
| Immigrants | Poland | 73.2 /100 | #150 | Good 5.3% |
| Immigrants | Indonesia | 72.9 /100 | #151 | Good 5.3% |
| Spanish | 72.6 /100 | #152 | Good 5.3% |
| Immigrants | Cabo Verde | 72.5 /100 | #153 | Good 5.3% |
| Poles | 72.4 /100 | #154 | Good 5.3% |