Tohono O'odham vs Iranian Unemployment Among Seniors over 65 years

COMPARE

Tohono O'odham
Race
Ancestry
AfghanAfricanAlaska NativeAlaskan AthabascanAlbanianAleutAlsatianAmericanApacheArabArapahoArgentineanArmenianAssyrian/Chaldean/SyriacAustralianAustrianBahamianBangladeshiBarbadianBasqueBelgianBelizeanBermudanBhutaneseBlackfeetBolivianBrazilianBritishBritish West IndianBulgarianBurmeseCajunCambodianCanadianCape VerdeanCarpatho RusynCelticCentral AmericanCentral American IndianCherokeeCheyenneChickasawChileanChineseChippewaChoctawColombianColvilleComancheCosta RicanCreeCreekCroatianCrowCubanCypriotCzechCzechoslovakianDanishDelawareDominicanDutchDutch West IndianEastern EuropeanEcuadorianEgyptianEnglishEstonianEthiopianEuropeanFijianFilipinoFinnishFrenchFrench American IndianFrench CanadianGermanGerman RussianGhanaianGreekGuamanian/ChamorroGuatemalanGuyaneseHaitianHmongHonduranHopiHoumaHungarianIcelanderIndian (Asian)IndonesianInupiatIraqiIrishIroquoisIsraeliItalianJamaicanJapaneseJordanianKenyanKiowaKoreanLaotianLatvianLebaneseLiberianLithuanianLumbeeLuxembourgerMacedonianMalaysianMalteseMarshalleseMenomineeMexicanMexican American IndianMongolianMoroccanNative HawaiianNavajoNepaleseNew ZealanderNicaraguanNigerianNorthern EuropeanNorwegianOkinawanOsageOttawaPaiutePakistaniPalestinianPanamanianParaguayanPennsylvania GermanPeruvianPimaPolishPortuguesePotawatomiPuebloPuerto RicanPuget Sound SalishRomanianRussianSalvadoranSamoanScandinavianScotch-IrishScottishSeminoleSenegaleseSerbianShoshoneSierra LeoneanSiouxSlavicSlovakSloveneSomaliSouth AfricanSouth AmericanSouth American IndianSoviet UnionSpaniardSpanishSpanish AmericanSpanish American IndianSri LankanSubsaharan AfricanSudaneseSwedishSwissSyrianTaiwaneseThaiTlingit-HaidaTohono O'OdhamTonganTrinidadian and TobagonianTsimshianTurkishU.S. Virgin IslanderUgandanUkrainianUruguayanUteVenezuelanVietnameseWelshWest IndianYakamaYaquiYugoslavianYumanYup'ikZimbabwean
Immigration
NonimmigrantsImmigrantsAfghanistanAfricaAlbaniaArgentinaArmeniaAsiaAustraliaAustriaBahamasBangladeshBarbadosBelarusBelgiumBelizeBoliviaBosnia and HerzegovinaBrazilBulgariaBurma/MyanmarCabo VerdeCambodiaCameroonCanadaCaribbeanCentral AmericaChileChinaColombiaCongoCosta RicaCroatiaCubaCzechoslovakiaDenmarkDominicaDominican RepublicEastern AfricaEastern AsiaEastern EuropeEcuadorEgyptEl SalvadorEnglandEritreaEthiopiaEuropeFijiFranceGermanyGhanaGreeceGrenadaGuatemalaGuyanaHaitiHondurasHong KongHungaryIndiaIndonesiaIranIraqIrelandIsraelItalyJamaicaJapanJordanKazakhstanKenyaKoreaKuwaitLaosLatin AmericaLatviaLebanonLiberiaLithuaniaMalaysiaMexicoMicronesiaMiddle AfricaMoldovaMoroccoNepalNetherlandsNicaraguaNigeriaNorth AmericaNorth MacedoniaNorthern AfricaNorthern EuropeNorwayOceaniaPakistanPanamaPeruPhilippinesPolandPortugalRomaniaRussiaSaudi ArabiaScotlandSenegalSerbiaSierra LeoneSingaporeSomaliaSouth AfricaSouth AmericaSouth Central AsiaSouth Eastern AsiaSouthern EuropeSpainSri LankaSt. Vincent and the GrenadinesSudanSwedenSwitzerlandSyriaTaiwanThailandTrinidad and TobagoTurkeyUgandaUkraineUruguayUzbekistanVenezuelaVietnamWest IndiesWestern AfricaWestern AsiaWestern EuropeYemenZaireZimbabweAzores
Iranian
Race
Ancestry
AfghanAfricanAlaska NativeAlaskan AthabascanAlbanianAleutAlsatianAmericanApacheArabArapahoArgentineanArmenianAssyrian/Chaldean/SyriacAustralianAustrianBahamianBangladeshiBarbadianBasqueBelgianBelizeanBermudanBhutaneseBlackfeetBolivianBrazilianBritishBritish West IndianBulgarianBurmeseCajunCambodianCanadianCape VerdeanCarpatho RusynCelticCentral AmericanCentral American IndianCherokeeCheyenneChickasawChileanChineseChippewaChoctawColombianColvilleComancheCosta RicanCreeCreekCroatianCrowCubanCypriotCzechCzechoslovakianDanishDelawareDominicanDutchDutch West IndianEastern EuropeanEcuadorianEgyptianEnglishEstonianEthiopianEuropeanFijianFilipinoFinnishFrenchFrench American IndianFrench CanadianGermanGerman RussianGhanaianGreekGuamanian/ChamorroGuatemalanGuyaneseHaitianHmongHonduranHopiHoumaHungarianIcelanderIndian (Asian)IndonesianInupiatIranianIraqiIrishIroquoisIsraeliItalianJamaicanJapaneseJordanianKenyanKiowaKoreanLaotianLatvianLebaneseLiberianLithuanianLumbeeLuxembourgerMacedonianMalaysianMalteseMarshalleseMenomineeMexicanMexican American IndianMongolianMoroccanNative HawaiianNavajoNepaleseNew ZealanderNicaraguanNigerianNorthern EuropeanNorwegianOkinawanOsageOttawaPaiutePakistaniPalestinianPanamanianParaguayanPennsylvania GermanPeruvianPimaPolishPortuguesePotawatomiPuebloPuerto RicanPuget Sound SalishRomanianRussianSalvadoranSamoanScandinavianScotch-IrishScottishSeminoleSenegaleseSerbianShoshoneSierra LeoneanSiouxSlavicSlovakSloveneSomaliSouth AfricanSouth AmericanSouth American IndianSoviet UnionSpaniardSpanishSpanish AmericanSpanish American IndianSri LankanSubsaharan AfricanSudaneseSwedishSwissSyrianTaiwaneseThaiTlingit-HaidaTonganTrinidadian and TobagonianTsimshianTurkishU.S. Virgin IslanderUgandanUkrainianUruguayanUteVenezuelanVietnameseWelshWest IndianYakamaYaquiYugoslavianYumanYup'ikZimbabwean
Immigration
NonimmigrantsImmigrantsAfghanistanAfricaAlbaniaArgentinaArmeniaAsiaAustraliaAustriaBahamasBangladeshBarbadosBelarusBelgiumBelizeBoliviaBosnia and HerzegovinaBrazilBulgariaBurma/MyanmarCabo VerdeCambodiaCameroonCanadaCaribbeanCentral AmericaChileChinaColombiaCongoCosta RicaCroatiaCubaCzechoslovakiaDenmarkDominicaDominican RepublicEastern AfricaEastern AsiaEastern EuropeEcuadorEgyptEl SalvadorEnglandEritreaEthiopiaEuropeFijiFranceGermanyGhanaGreeceGrenadaGuatemalaGuyanaHaitiHondurasHong KongHungaryIndiaIndonesiaIranIraqIrelandIsraelItalyJamaicaJapanJordanKazakhstanKenyaKoreaKuwaitLaosLatin AmericaLatviaLebanonLiberiaLithuaniaMalaysiaMexicoMicronesiaMiddle AfricaMoldovaMoroccoNepalNetherlandsNicaraguaNigeriaNorth AmericaNorth MacedoniaNorthern AfricaNorthern EuropeNorwayOceaniaPakistanPanamaPeruPhilippinesPolandPortugalRomaniaRussiaSaudi ArabiaScotlandSenegalSerbiaSierra LeoneSingaporeSomaliaSouth AfricaSouth AmericaSouth Central AsiaSouth Eastern AsiaSouthern EuropeSpainSri LankaSt. Vincent and the GrenadinesSudanSwedenSwitzerlandSyriaTaiwanThailandTrinidad and TobagoTurkeyUgandaUkraineUruguayUzbekistanVenezuelaVietnamWest IndiesWestern AfricaWestern AsiaWestern EuropeYemenZaireZimbabweAzores
Unemployment Among Seniors over 65 years
Income
Poverty
Unemployment
Labor Participation
Family Structure
Vehicle Availability
Education Level
Disability

Unemployment Among Seniors over 65 years Comparison

Tohono O'odham

Iranians

Tragic
Excellent
6.1%
UNEMPLOYMENT AMONG SENIORS OVER 65 YEARS
0.0/ 100
METRIC RATING
334th/ 347
METRIC RANK
5.1%
UNEMPLOYMENT AMONG SENIORS OVER 65 YEARS
86.6/ 100
METRIC RATING
130th/ 347
METRIC RANK

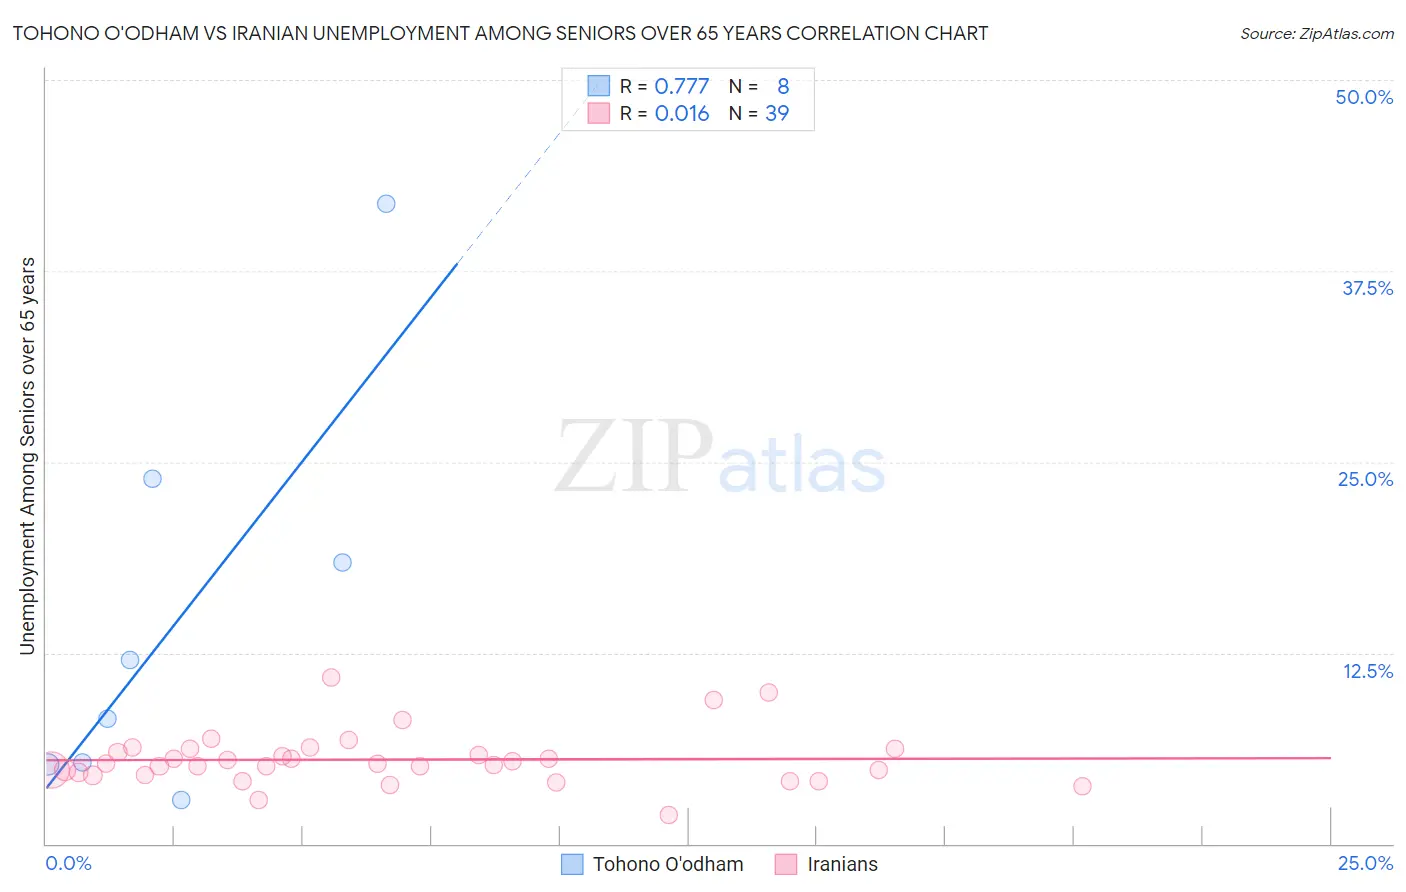
Tohono O'odham vs Iranian Unemployment Among Seniors over 65 years Correlation Chart

The statistical analysis conducted on geographies consisting of 57,554,750 people shows a strong positive correlation between the proportion of Tohono O'odham and unemployment rate amomg seniors over the age of 65 in the United States with a correlation coefficient (R) of 0.777 and weighted average of 6.1%. Similarly, the statistical analysis conducted on geographies consisting of 294,545,936 people shows no correlation between the proportion of Iranians and unemployment rate amomg seniors over the age of 65 in the United States with a correlation coefficient (R) of 0.016 and weighted average of 5.1%, a difference of 21.1%.
Tohono O'odham vs Iranian Unemployment Among Seniors over 65 years

Unemployment Among Seniors over 65 years Correlation Summary

MeasurementTohono O'odhamIranian
Minimum2.8%1.9%
Maximum41.9%10.9%
Range39.1%9.0%
Mean14.7%5.5%
Median10.1%5.2%
Interquartile 25% (IQ1)5.2%4.5%
Interquartile 75% (IQ3)21.1%6.2%
Interquartile Range (IQR)15.9%1.7%
Standard Deviation (Sample)13.1%1.7%
Standard Deviation (Population)12.3%1.7%

Similar Demographics by Unemployment Among Seniors over 65 years

Demographics Similar to Tohono O'odham by Unemployment Among Seniors over 65 years

In terms of unemployment among seniors over 65 years, the demographic groups most similar to Tohono O'odham are Immigrants from Armenia (6.2%, a difference of 0.28%), Pima (6.3%, a difference of 2.1%), Immigrants from Dominican Republic (6.0%, a difference of 2.2%), Alaska Native (6.3%, a difference of 2.6%), and Aleut (6.0%, a difference of 2.7%).
DemographicsRating | RankUnemployment Among Seniors over 65 years
Bermudans
0.0
/100
|
#327
Tragic
5.9%
Puerto Ricans
0.0
/100
|
#328
Tragic
5.9%
Dominicans
0.0
/100
|
#329
Tragic
6.0%
Immigrants | Portugal
0.0
/100
|
#330
Tragic
6.0%
Taiwanese
0.0
/100
|
#331
Tragic
6.0%
Aleuts
0.0
/100
|
#332
Tragic
6.0%
Immigrants | Dominican Republic
0.0
/100
|
#333
Tragic
6.0%
Tohono O'odham
0.0
/100
|
#334
Tragic
6.1%
Immigrants | Armenia
0.0
/100
|
#335
Tragic
6.2%
Pima
0.0
/100
|
#336
Tragic
6.3%
Alaska Natives
0.0
/100
|
#337
Tragic
6.3%
Immigrants | Azores
0.0
/100
|
#338
Tragic
6.3%
Paiute
0.0
/100
|
#339
Tragic
6.3%
Ute
0.0
/100
|
#340
Tragic
6.3%
Yakama
0.0
/100
|
#341
Tragic
6.7%

Demographics Similar to Iranians by Unemployment Among Seniors over 65 years

In terms of unemployment among seniors over 65 years, the demographic groups most similar to Iranians are Immigrants from England (5.1%, a difference of 0.010%), Australian (5.1%, a difference of 0.040%), Sri Lankan (5.1%, a difference of 0.050%), Immigrants from Sri Lanka (5.1%, a difference of 0.060%), and Immigrants from Australia (5.1%, a difference of 0.060%).
DemographicsRating | RankUnemployment Among Seniors over 65 years
Asians
88.5
/100
|
#123
Excellent
5.1%
Immigrants | North America
87.9
/100
|
#124
Excellent
5.1%
Dutch
87.6
/100
|
#125
Excellent
5.1%
Immigrants | Sri Lanka
87.4
/100
|
#126
Excellent
5.1%
Sri Lankans
87.4
/100
|
#127
Excellent
5.1%
Australians
87.1
/100
|
#128
Excellent
5.1%
Immigrants | England
86.7
/100
|
#129
Excellent
5.1%
Iranians
86.6
/100
|
#130
Excellent
5.1%
Immigrants | Australia
85.8
/100
|
#131
Excellent
5.1%
Chileans
85.6
/100
|
#132
Excellent
5.1%
Syrians
85.3
/100
|
#133
Excellent
5.1%
Turks
84.9
/100
|
#134
Excellent
5.1%
Ukrainians
84.4
/100
|
#135
Excellent
5.1%
Whites/Caucasians
84.4
/100
|
#136
Excellent
5.1%
Arabs
84.3
/100
|
#137
Excellent
5.1%