Tlingit-Haida vs Ukrainian Unemployment Among Seniors over 75 years

COMPARE

Tlingit-Haida
Race
Ancestry
AfghanAfricanAlaska NativeAlaskan AthabascanAlbanianAleutAlsatianAmericanApacheArabArapahoArgentineanArmenianAssyrian/Chaldean/SyriacAustralianAustrianBahamianBangladeshiBarbadianBasqueBelgianBelizeanBermudanBhutaneseBlackfeetBolivianBrazilianBritishBritish West IndianBulgarianBurmeseCajunCambodianCanadianCape VerdeanCarpatho RusynCelticCentral AmericanCentral American IndianCherokeeCheyenneChickasawChileanChineseChippewaChoctawColombianColvilleComancheCosta RicanCreeCreekCroatianCrowCubanCypriotCzechCzechoslovakianDanishDelawareDominicanDutchDutch West IndianEastern EuropeanEcuadorianEgyptianEnglishEstonianEthiopianEuropeanFijianFilipinoFinnishFrenchFrench American IndianFrench CanadianGermanGerman RussianGhanaianGreekGuamanian/ChamorroGuatemalanGuyaneseHaitianHmongHonduranHopiHoumaHungarianIcelanderIndian (Asian)IndonesianInupiatIranianIraqiIrishIroquoisIsraeliItalianJamaicanJapaneseJordanianKenyanKiowaKoreanLaotianLatvianLebaneseLiberianLithuanianLumbeeLuxembourgerMacedonianMalaysianMalteseMarshalleseMexicanMexican American IndianMongolianMoroccanNative HawaiianNavajoNepaleseNew ZealanderNicaraguanNigerianNorthern EuropeanNorwegianOkinawanOsageOttawaPaiutePakistaniPalestinianPanamanianParaguayanPennsylvania GermanPeruvianPimaPolishPortuguesePotawatomiPuebloPuerto RicanPuget Sound SalishRomanianRussianSalvadoranSamoanScandinavianScotch-IrishScottishSeminoleSenegaleseSerbianShoshoneSierra LeoneanSiouxSlavicSlovakSloveneSomaliSouth AfricanSouth AmericanSouth American IndianSoviet UnionSpaniardSpanishSpanish AmericanSpanish American IndianSri LankanSubsaharan AfricanSudaneseSwedishSwissSyrianTaiwaneseThaiTlingit-HaidaTohono O'OdhamTonganTrinidadian and TobagonianTsimshianTurkishU.S. Virgin IslanderUgandanUruguayanUteVenezuelanVietnameseWelshWest IndianYakamaYaquiYugoslavianYumanYup'ikZimbabwean
Immigration
NonimmigrantsImmigrantsAfghanistanAfricaAlbaniaArgentinaArmeniaAsiaAustraliaAustriaBahamasBangladeshBarbadosBelarusBelgiumBelizeBoliviaBosnia and HerzegovinaBrazilBulgariaBurma/MyanmarCabo VerdeCambodiaCameroonCanadaCaribbeanCentral AmericaChileChinaColombiaCongoCosta RicaCroatiaCubaCzechoslovakiaDenmarkDominicaDominican RepublicEastern AfricaEastern AsiaEastern EuropeEcuadorEgyptEl SalvadorEnglandEritreaEthiopiaEuropeFijiFranceGermanyGhanaGreeceGrenadaGuatemalaGuyanaHaitiHondurasHong KongHungaryIndiaIndonesiaIranIraqIrelandIsraelItalyJamaicaJapanJordanKazakhstanKenyaKoreaKuwaitLaosLatin AmericaLatviaLebanonLiberiaLithuaniaMalaysiaMexicoMicronesiaMiddle AfricaMoldovaMoroccoNepalNetherlandsNicaraguaNigeriaNorth AmericaNorth MacedoniaNorthern AfricaNorthern EuropeNorwayOceaniaPakistanPanamaPeruPhilippinesPolandPortugalRomaniaRussiaSaudi ArabiaScotlandSenegalSerbiaSierra LeoneSingaporeSomaliaSouth AfricaSouth AmericaSouth Central AsiaSouth Eastern AsiaSouthern EuropeSpainSri LankaSt. Vincent and the GrenadinesSudanSwedenSwitzerlandSyriaTaiwanThailandTrinidad and TobagoTurkeyUgandaUkraineUruguayUzbekistanVenezuelaVietnamWest IndiesWestern AfricaWestern AsiaWestern EuropeYemenZaireZimbabweAzores
Ukrainian
Race
Ancestry
AfghanAfricanAlaska NativeAlaskan AthabascanAlbanianAleutAlsatianAmericanApacheArabArapahoArgentineanArmenianAssyrian/Chaldean/SyriacAustralianAustrianBahamianBangladeshiBarbadianBasqueBelgianBelizeanBermudanBhutaneseBlackfeetBolivianBrazilianBritishBritish West IndianBulgarianBurmeseCajunCambodianCanadianCape VerdeanCarpatho RusynCelticCentral AmericanCentral American IndianCherokeeCheyenneChickasawChileanChineseChippewaChoctawColombianColvilleComancheCosta RicanCreeCreekCroatianCrowCubanCypriotCzechCzechoslovakianDanishDelawareDominicanDutchDutch West IndianEastern EuropeanEcuadorianEgyptianEnglishEstonianEthiopianEuropeanFijianFilipinoFinnishFrenchFrench American IndianFrench CanadianGermanGerman RussianGhanaianGreekGuamanian/ChamorroGuatemalanGuyaneseHaitianHmongHonduranHopiHoumaHungarianIcelanderIndian (Asian)IndonesianInupiatIranianIraqiIrishIroquoisIsraeliItalianJamaicanJapaneseJordanianKenyanKiowaKoreanLaotianLatvianLebaneseLiberianLithuanianLumbeeLuxembourgerMacedonianMalaysianMalteseMarshalleseMexicanMexican American IndianMongolianMoroccanNative HawaiianNavajoNepaleseNew ZealanderNicaraguanNigerianNorthern EuropeanNorwegianOkinawanOsageOttawaPaiutePakistaniPalestinianPanamanianParaguayanPennsylvania GermanPeruvianPimaPolishPortuguesePotawatomiPuebloPuerto RicanPuget Sound SalishRomanianRussianSalvadoranSamoanScandinavianScotch-IrishScottishSeminoleSenegaleseSerbianShoshoneSierra LeoneanSiouxSlavicSlovakSloveneSomaliSouth AfricanSouth AmericanSouth American IndianSoviet UnionSpaniardSpanishSpanish AmericanSpanish American IndianSri LankanSubsaharan AfricanSudaneseSwedishSwissSyrianTaiwaneseThaiTohono O'OdhamTonganTrinidadian and TobagonianTsimshianTurkishU.S. Virgin IslanderUgandanUkrainianUruguayanUteVenezuelanVietnameseWelshWest IndianYakamaYaquiYugoslavianYumanYup'ikZimbabwean
Immigration
NonimmigrantsImmigrantsAfghanistanAfricaAlbaniaArgentinaArmeniaAsiaAustraliaAustriaBahamasBangladeshBarbadosBelarusBelgiumBelizeBoliviaBosnia and HerzegovinaBrazilBulgariaBurma/MyanmarCabo VerdeCambodiaCameroonCanadaCaribbeanCentral AmericaChileChinaColombiaCongoCosta RicaCroatiaCubaCzechoslovakiaDenmarkDominicaDominican RepublicEastern AfricaEastern AsiaEastern EuropeEcuadorEgyptEl SalvadorEnglandEritreaEthiopiaEuropeFijiFranceGermanyGhanaGreeceGrenadaGuatemalaGuyanaHaitiHondurasHong KongHungaryIndiaIndonesiaIranIraqIrelandIsraelItalyJamaicaJapanJordanKazakhstanKenyaKoreaKuwaitLaosLatin AmericaLatviaLebanonLiberiaLithuaniaMalaysiaMexicoMicronesiaMiddle AfricaMoldovaMoroccoNepalNetherlandsNicaraguaNigeriaNorth AmericaNorth MacedoniaNorthern AfricaNorthern EuropeNorwayOceaniaPakistanPanamaPeruPhilippinesPolandPortugalRomaniaRussiaSaudi ArabiaScotlandSenegalSerbiaSierra LeoneSingaporeSomaliaSouth AfricaSouth AmericaSouth Central AsiaSouth Eastern AsiaSouthern EuropeSpainSri LankaSt. Vincent and the GrenadinesSudanSwedenSwitzerlandSyriaTaiwanThailandTrinidad and TobagoTurkeyUgandaUkraineUruguayUzbekistanVenezuelaVietnamWest IndiesWestern AfricaWestern AsiaWestern EuropeYemenZaireZimbabweAzores
Unemployment Among Seniors over 75 years
Income
Poverty
Unemployment
Labor Participation
Family Structure
Vehicle Availability
Education Level
Disability

Unemployment Among Seniors over 75 years Comparison

Tlingit-Haida

Ukrainians

Tragic
Tragic
20.7%
UNEMPLOYMENT AMONG SENIORS OVER 75 YEARS
0.0/ 100
METRIC RATING
346th/ 347
METRIC RANK
9.3%
UNEMPLOYMENT AMONG SENIORS OVER 75 YEARS
0.7/ 100
METRIC RATING
263rd/ 347
METRIC RANK

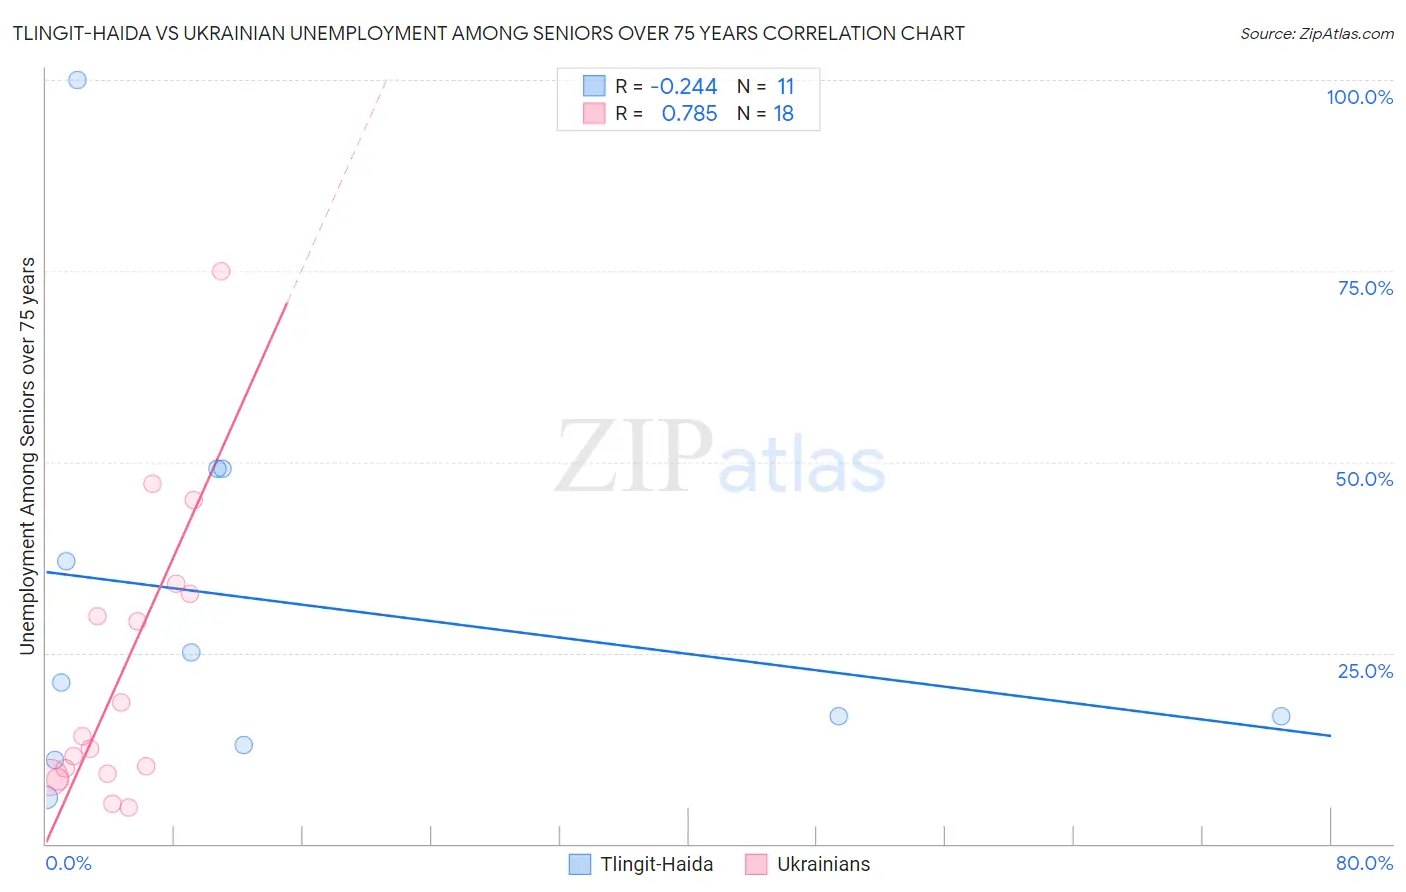
Tlingit-Haida vs Ukrainian Unemployment Among Seniors over 75 years Correlation Chart

The statistical analysis conducted on geographies consisting of 44,675,055 people shows a weak negative correlation between the proportion of Tlingit-Haida and unemployment rate among seniors over the age of 75 in the United States with a correlation coefficient (R) of -0.244 and weighted average of 20.7%. Similarly, the statistical analysis conducted on geographies consisting of 214,568,076 people shows a strong positive correlation between the proportion of Ukrainians and unemployment rate among seniors over the age of 75 in the United States with a correlation coefficient (R) of 0.785 and weighted average of 9.3%, a difference of 122.2%.
Tlingit-Haida vs Ukrainian Unemployment Among Seniors over 75 years

Unemployment Among Seniors over 75 years Correlation Summary

MeasurementTlingit-HaidaUkrainian
Minimum6.1%4.8%
Maximum100.0%75.0%
Range93.9%70.2%
Mean31.3%22.5%
Median21.1%13.3%
Interquartile 25% (IQ1)13.0%9.2%
Interquartile 75% (IQ3)49.1%32.7%
Interquartile Range (IQR)36.1%23.5%
Standard Deviation (Sample)27.1%18.8%
Standard Deviation (Population)25.8%18.3%

Similar Demographics by Unemployment Among Seniors over 75 years

Demographics Similar to Tlingit-Haida by Unemployment Among Seniors over 75 years

In terms of unemployment among seniors over 75 years, the demographic groups most similar to Tlingit-Haida are Yakama (18.4%, a difference of 12.6%), Immigrants from Yemen (16.5%, a difference of 25.8%), Alaska Native (14.7%, a difference of 41.4%), Hmong (13.7%, a difference of 51.0%), and Lumbee (13.5%, a difference of 54.1%).
DemographicsRating | RankUnemployment Among Seniors over 75 years
Alaskan Athabascans
0.0
/100
|
#333
Tragic
11.0%
Assyrians/Chaldeans/Syriacs
0.0
/100
|
#334
Tragic
11.1%
French Canadians
0.0
/100
|
#335
Tragic
11.2%
Immigrants | North Macedonia
0.0
/100
|
#336
Tragic
11.3%
Cape Verdeans
0.0
/100
|
#337
Tragic
11.4%
Immigrants | Cabo Verde
0.0
/100
|
#338
Tragic
12.3%
Cajuns
0.0
/100
|
#339
Tragic
12.5%
Yup'ik
0.0
/100
|
#340
Tragic
12.8%
Lumbee
0.0
/100
|
#341
Tragic
13.5%
Hmong
0.0
/100
|
#342
Tragic
13.7%
Alaska Natives
0.0
/100
|
#343
Tragic
14.7%
Immigrants | Yemen
0.0
/100
|
#344
Tragic
16.5%
Yakama
0.0
/100
|
#345
Tragic
18.4%
Tlingit-Haida
0.0
/100
|
#346
Tragic
20.7%

Demographics Similar to Ukrainians by Unemployment Among Seniors over 75 years

In terms of unemployment among seniors over 75 years, the demographic groups most similar to Ukrainians are Iroquois (9.3%, a difference of 0.010%), Austrian (9.3%, a difference of 0.12%), Palestinian (9.3%, a difference of 0.13%), Celtic (9.3%, a difference of 0.22%), and Black/African American (9.4%, a difference of 0.46%).
DemographicsRating | RankUnemployment Among Seniors over 75 years
Brazilians
1.3
/100
|
#256
Tragic
9.3%
Hawaiians
1.2
/100
|
#257
Tragic
9.3%
Immigrants | England
1.0
/100
|
#258
Tragic
9.3%
Slovenes
1.0
/100
|
#259
Tragic
9.3%
Immigrants | Cameroon
1.0
/100
|
#260
Tragic
9.3%
Celtics
0.8
/100
|
#261
Tragic
9.3%
Austrians
0.7
/100
|
#262
Tragic
9.3%
Ukrainians
0.7
/100
|
#263
Tragic
9.3%
Iroquois
0.7
/100
|
#264
Tragic
9.3%
Palestinians
0.6
/100
|
#265
Tragic
9.3%
Blacks/African Americans
0.5
/100
|
#266
Tragic
9.4%
Immigrants | Mexico
0.4
/100
|
#267
Tragic
9.4%
Greeks
0.4
/100
|
#268
Tragic
9.4%
Puerto Ricans
0.3
/100
|
#269
Tragic
9.4%
Yaqui
0.3
/100
|
#270
Tragic
9.4%