Tlingit-Haida vs Scotch-Irish Unemployment Among Women with Children Under 18 years
COMPARE
Tlingit-Haida
Scotch-Irish
Unemployment Among Women with Children Under 18 years
Unemployment Among Women with Children Under 18 years Comparison
Tlingit-Haida
Scotch-Irish
5.4%
UNEMPLOYMENT AMONG WOMEN WITH CHILDREN UNDER 18 YEARS
61.9/ 100
METRIC RATING
165th/ 347
METRIC RANK
5.3%
UNEMPLOYMENT AMONG WOMEN WITH CHILDREN UNDER 18 YEARS
85.7/ 100
METRIC RATING
122nd/ 347
METRIC RANK
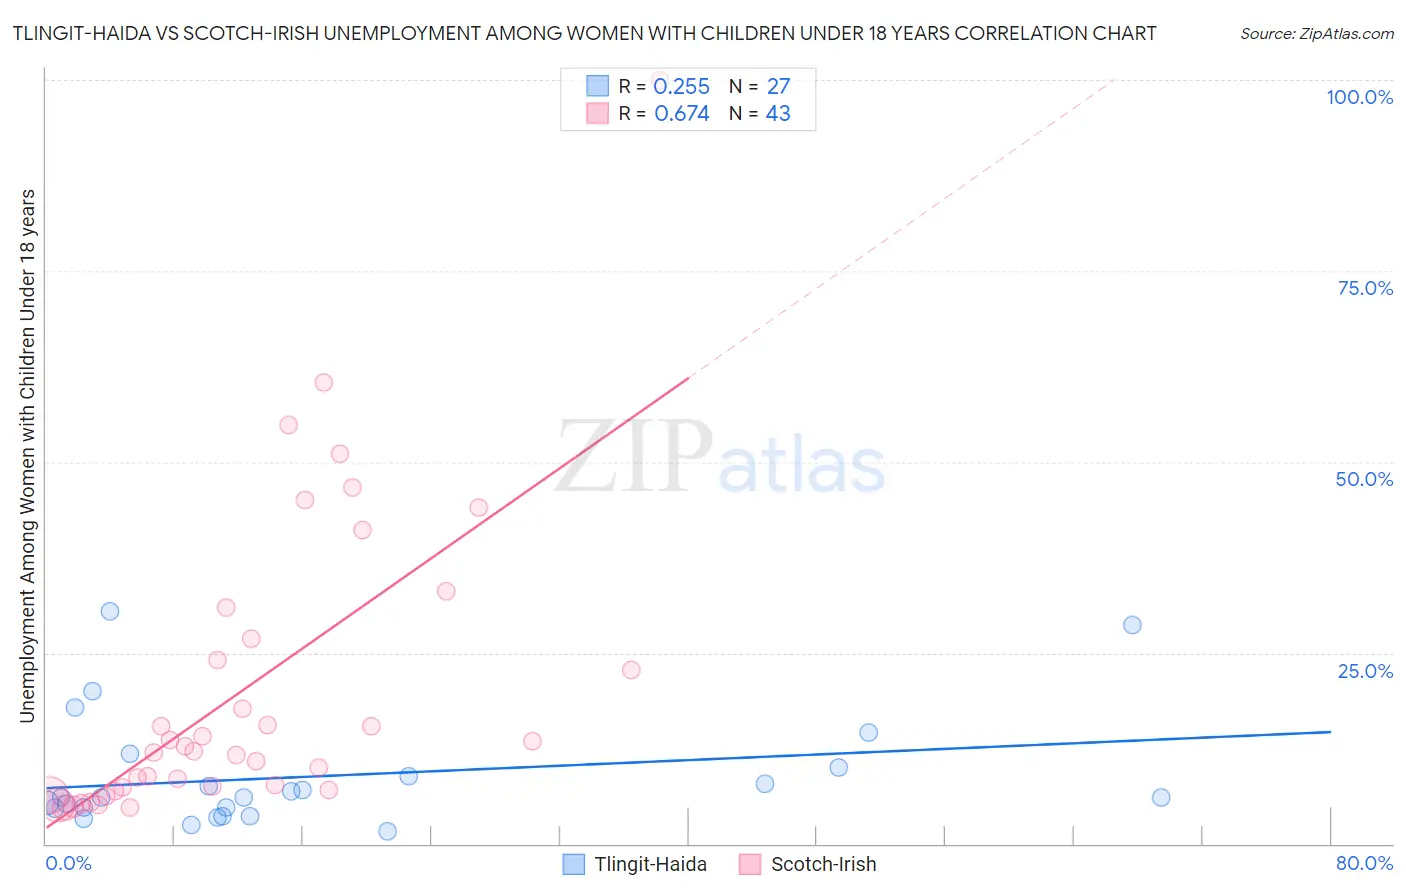
Tlingit-Haida vs Scotch-Irish Unemployment Among Women with Children Under 18 years Correlation Chart
The statistical analysis conducted on geographies consisting of 59,920,884 people shows a weak positive correlation between the proportion of Tlingit-Haida and unemployment rate among women with children under the age of 18 in the United States with a correlation coefficient (R) of 0.255 and weighted average of 5.4%. Similarly, the statistical analysis conducted on geographies consisting of 498,737,336 people shows a significant positive correlation between the proportion of Scotch-Irish and unemployment rate among women with children under the age of 18 in the United States with a correlation coefficient (R) of 0.674 and weighted average of 5.3%, a difference of 2.4%.
Unemployment Among Women with Children Under 18 years Correlation Summary
| Measurement | Tlingit-Haida | Scotch-Irish |
| Minimum | 1.6% | 4.7% |
| Maximum | 30.5% | 100.0% |
| Range | 28.9% | 95.3% |
| Mean | 8.8% | 20.1% |
| Median | 6.1% | 12.1% |
| Interquartile 25% (IQ1) | 4.7% | 7.0% |
| Interquartile 75% (IQ3) | 10.0% | 26.8% |
| Interquartile Range (IQR) | 5.3% | 19.8% |
| Standard Deviation (Sample) | 7.4% | 19.9% |
| Standard Deviation (Population) | 7.3% | 19.7% |
Similar Demographics by Unemployment Among Women with Children Under 18 years
Demographics Similar to Tlingit-Haida by Unemployment Among Women with Children Under 18 years
In terms of unemployment among women with children under 18 years, the demographic groups most similar to Tlingit-Haida are Celtic (5.4%, a difference of 0.090%), Aleut (5.4%, a difference of 0.19%), Lebanese (5.4%, a difference of 0.22%), Immigrants from Saudi Arabia (5.4%, a difference of 0.24%), and Immigrants from Denmark (5.4%, a difference of 0.29%).
| Demographics | Rating | Rank | Unemployment Among Women with Children Under 18 years |
| Immigrants | Burma/Myanmar | 69.5 /100 | #158 | Good 5.4% |
| Chickasaw | 68.4 /100 | #159 | Good 5.4% |
| Afghans | 66.6 /100 | #160 | Good 5.4% |
| Immigrants | Iraq | 65.9 /100 | #161 | Good 5.4% |
| Immigrants | Saudi Arabia | 65.0 /100 | #162 | Good 5.4% |
| Lebanese | 64.7 /100 | #163 | Good 5.4% |
| Celtics | 63.0 /100 | #164 | Good 5.4% |
| Tlingit-Haida | 61.9 /100 | #165 | Good 5.4% |
| Aleuts | 59.4 /100 | #166 | Average 5.4% |
| Immigrants | Denmark | 58.0 /100 | #167 | Average 5.4% |
| Immigrants | Northern Africa | 56.1 /100 | #168 | Average 5.4% |
| Immigrants | Thailand | 55.3 /100 | #169 | Average 5.4% |
| Samoans | 54.1 /100 | #170 | Average 5.4% |
| Immigrants | Philippines | 53.1 /100 | #171 | Average 5.4% |
| Immigrants | Kazakhstan | 51.7 /100 | #172 | Average 5.4% |
Demographics Similar to Scotch-Irish by Unemployment Among Women with Children Under 18 years
In terms of unemployment among women with children under 18 years, the demographic groups most similar to Scotch-Irish are Immigrants from Romania (5.3%, a difference of 0.010%), Egyptian (5.3%, a difference of 0.11%), Basque (5.3%, a difference of 0.13%), Immigrants from Europe (5.3%, a difference of 0.16%), and Sudanese (5.3%, a difference of 0.20%).
| Demographics | Rating | Rank | Unemployment Among Women with Children Under 18 years |
| Hungarians | 88.1 /100 | #115 | Excellent 5.3% |
| Macedonians | 87.7 /100 | #116 | Excellent 5.3% |
| Canadians | 87.4 /100 | #117 | Excellent 5.3% |
| Immigrants | Europe | 86.7 /100 | #118 | Excellent 5.3% |
| Basques | 86.5 /100 | #119 | Excellent 5.3% |
| Egyptians | 86.4 /100 | #120 | Excellent 5.3% |
| Immigrants | Romania | 85.8 /100 | #121 | Excellent 5.3% |
| Scotch-Irish | 85.7 /100 | #122 | Excellent 5.3% |
| Sudanese | 84.3 /100 | #123 | Excellent 5.3% |
| Native Hawaiians | 84.0 /100 | #124 | Excellent 5.3% |
| Immigrants | North Macedonia | 83.2 /100 | #125 | Excellent 5.3% |
| Immigrants | Oceania | 83.1 /100 | #126 | Excellent 5.3% |
| Whites/Caucasians | 82.9 /100 | #127 | Excellent 5.3% |
| Immigrants | South Africa | 82.8 /100 | #128 | Excellent 5.3% |
| Immigrants | Italy | 82.3 /100 | #129 | Excellent 5.3% |