Tlingit-Haida vs Immigrants from Yemen Unemployment Among Ages 25 to 29 years
COMPARE
Tlingit-Haida
Immigrants from Yemen
Unemployment Among Ages 25 to 29 years
Unemployment Among Ages 25 to 29 years Comparison
Tlingit-Haida
Immigrants from Yemen
8.7%
UNEMPLOYMENT AMONG AGES 25 TO 29 YEARS
0.0/ 100
METRIC RATING
322nd/ 347
METRIC RANK
8.0%
UNEMPLOYMENT AMONG AGES 25 TO 29 YEARS
0.0/ 100
METRIC RATING
303rd/ 347
METRIC RANK
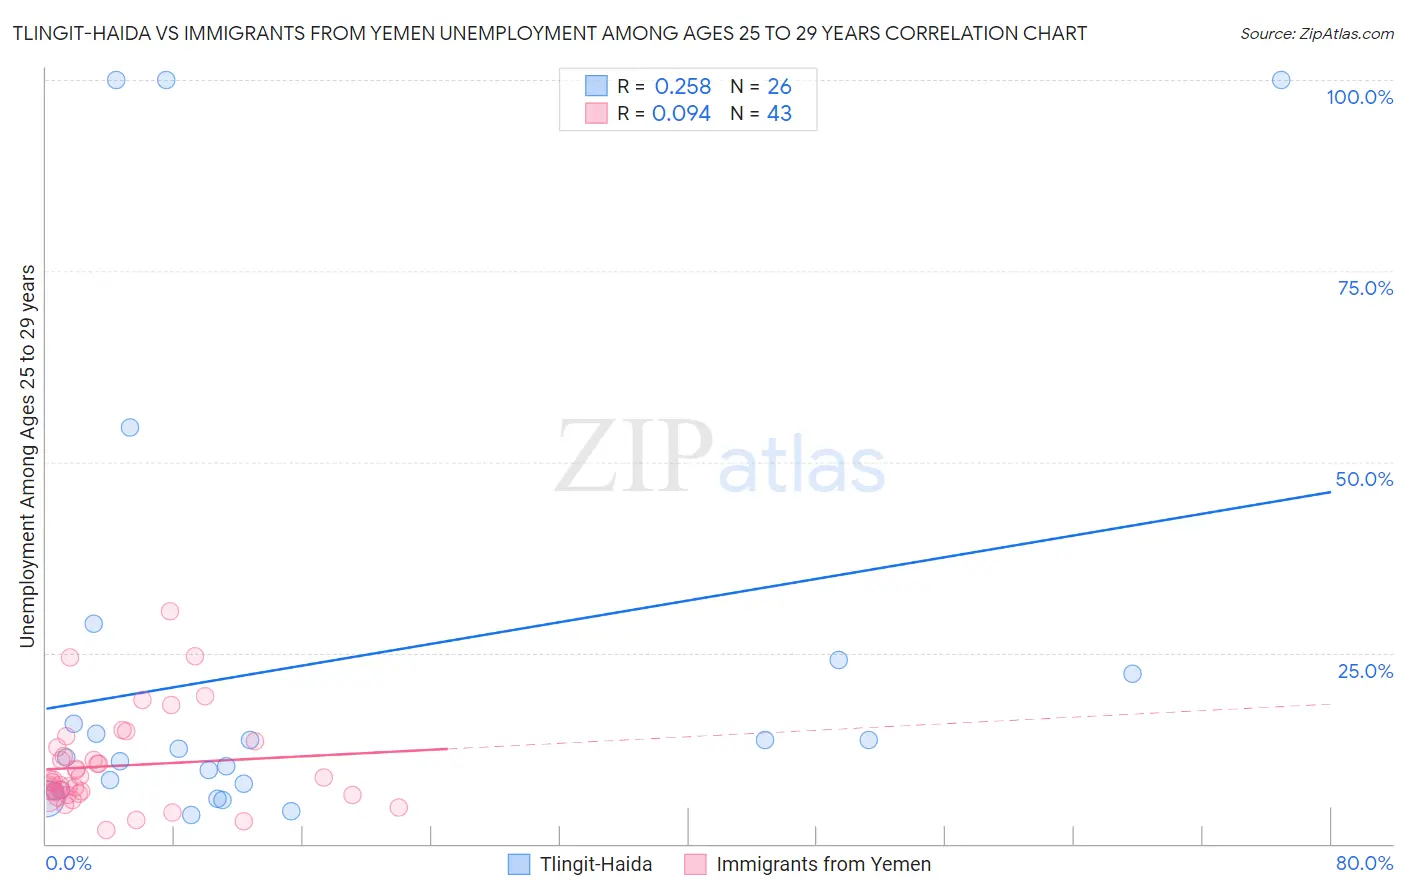
Tlingit-Haida vs Immigrants from Yemen Unemployment Among Ages 25 to 29 years Correlation Chart
The statistical analysis conducted on geographies consisting of 59,716,072 people shows a weak positive correlation between the proportion of Tlingit-Haida and unemployment rate among population between the ages 25 and 29 in the United States with a correlation coefficient (R) of 0.258 and weighted average of 8.7%. Similarly, the statistical analysis conducted on geographies consisting of 81,785,794 people shows a slight positive correlation between the proportion of Immigrants from Yemen and unemployment rate among population between the ages 25 and 29 in the United States with a correlation coefficient (R) of 0.094 and weighted average of 8.0%, a difference of 8.6%.
Unemployment Among Ages 25 to 29 years Correlation Summary
| Measurement | Tlingit-Haida | Immigrants from Yemen |
| Minimum | 3.8% | 1.8% |
| Maximum | 100.0% | 30.4% |
| Range | 96.2% | 28.6% |
| Mean | 23.5% | 10.2% |
| Median | 11.9% | 8.3% |
| Interquartile 25% (IQ1) | 7.0% | 6.4% |
| Interquartile 75% (IQ3) | 22.2% | 12.6% |
| Interquartile Range (IQR) | 15.2% | 6.2% |
| Standard Deviation (Sample) | 30.0% | 6.1% |
| Standard Deviation (Population) | 29.4% | 6.0% |
Demographics Similar to Tlingit-Haida and Immigrants from Yemen by Unemployment Among Ages 25 to 29 years
In terms of unemployment among ages 25 to 29 years, the demographic groups most similar to Tlingit-Haida are Immigrants from Dominican Republic (8.6%, a difference of 0.78%), Black/African American (8.6%, a difference of 1.4%), Immigrants from Armenia (8.5%, a difference of 2.1%), Guyanese (8.5%, a difference of 2.4%), and Immigrants from Guyana (8.5%, a difference of 2.6%). Similarly, the demographic groups most similar to Immigrants from Yemen are Cajun (8.0%, a difference of 0.22%), Tsimshian (8.0%, a difference of 0.48%), Haitian (8.0%, a difference of 0.56%), Immigrants from Barbados (8.0%, a difference of 0.72%), and Jamaican (7.9%, a difference of 0.94%).
| Demographics | Rating | Rank | Unemployment Among Ages 25 to 29 years |
| Jamaicans | 0.0 /100 | #302 | Tragic 7.9% |
| Immigrants | Yemen | 0.0 /100 | #303 | Tragic 8.0% |
| Cajuns | 0.0 /100 | #304 | Tragic 8.0% |
| Tsimshian | 0.0 /100 | #305 | Tragic 8.0% |
| Haitians | 0.0 /100 | #306 | Tragic 8.0% |
| Immigrants | Barbados | 0.0 /100 | #307 | Tragic 8.0% |
| Immigrants | Jamaica | 0.0 /100 | #308 | Tragic 8.1% |
| Immigrants | Haiti | 0.0 /100 | #309 | Tragic 8.1% |
| U.S. Virgin Islanders | 0.0 /100 | #310 | Tragic 8.1% |
| Immigrants | Azores | 0.0 /100 | #311 | Tragic 8.1% |
| Dutch West Indians | 0.0 /100 | #312 | Tragic 8.2% |
| Immigrants | St. Vincent and the Grenadines | 0.0 /100 | #313 | Tragic 8.4% |
| Immigrants | Dominica | 0.0 /100 | #314 | Tragic 8.4% |
| British West Indians | 0.0 /100 | #315 | Tragic 8.4% |
| Immigrants | Grenada | 0.0 /100 | #316 | Tragic 8.4% |
| Immigrants | Guyana | 0.0 /100 | #317 | Tragic 8.5% |
| Guyanese | 0.0 /100 | #318 | Tragic 8.5% |
| Immigrants | Armenia | 0.0 /100 | #319 | Tragic 8.5% |
| Blacks/African Americans | 0.0 /100 | #320 | Tragic 8.6% |
| Immigrants | Dominican Republic | 0.0 /100 | #321 | Tragic 8.6% |
| Tlingit-Haida | 0.0 /100 | #322 | Tragic 8.7% |