Tlingit-Haida vs Immigrants from Micronesia Unemployment Among Ages 65 to 74 years

COMPARE

Tlingit-Haida
Race
Ancestry
AfghanAfricanAlaska NativeAlaskan AthabascanAlbanianAleutAlsatianAmericanApacheArabArapahoArgentineanArmenianAssyrian/Chaldean/SyriacAustralianAustrianBahamianBangladeshiBarbadianBasqueBelgianBelizeanBermudanBhutaneseBlackfeetBolivianBrazilianBritishBritish West IndianBulgarianBurmeseCajunCambodianCanadianCape VerdeanCarpatho RusynCelticCentral AmericanCentral American IndianCherokeeCheyenneChickasawChileanChineseChippewaChoctawColombianColvilleComancheCosta RicanCreeCreekCroatianCrowCubanCypriotCzechCzechoslovakianDanishDelawareDominicanDutchDutch West IndianEastern EuropeanEcuadorianEgyptianEnglishEstonianEthiopianEuropeanFijianFilipinoFinnishFrenchFrench American IndianFrench CanadianGermanGerman RussianGhanaianGreekGuamanian/ChamorroGuatemalanGuyaneseHaitianHmongHonduranHopiHoumaHungarianIcelanderIndian (Asian)IndonesianInupiatIranianIraqiIrishIroquoisIsraeliItalianJamaicanJapaneseJordanianKenyanKiowaKoreanLaotianLatvianLebaneseLiberianLithuanianLumbeeLuxembourgerMacedonianMalaysianMalteseMarshalleseMenomineeMexicanMexican American IndianMongolianMoroccanNative HawaiianNavajoNepaleseNew ZealanderNicaraguanNigerianNorthern EuropeanNorwegianOkinawanOsageOttawaPaiutePakistaniPalestinianPanamanianParaguayanPennsylvania GermanPeruvianPimaPolishPortuguesePotawatomiPuebloPuerto RicanPuget Sound SalishRomanianRussianSalvadoranSamoanScandinavianScotch-IrishScottishSeminoleSenegaleseSerbianShoshoneSierra LeoneanSiouxSlavicSlovakSloveneSomaliSouth AfricanSouth AmericanSouth American IndianSoviet UnionSpaniardSpanishSpanish AmericanSpanish American IndianSri LankanSubsaharan AfricanSudaneseSwedishSwissSyrianTaiwaneseThaiTlingit-HaidaTohono O'OdhamTonganTrinidadian and TobagonianTsimshianTurkishU.S. Virgin IslanderUgandanUkrainianUruguayanUteVenezuelanVietnameseWelshWest IndianYakamaYaquiYugoslavianYumanYup'ikZimbabwean
Immigration
NonimmigrantsImmigrantsAfghanistanAfricaAlbaniaArgentinaArmeniaAsiaAustraliaAustriaBahamasBangladeshBarbadosBelarusBelgiumBelizeBoliviaBosnia and HerzegovinaBrazilBulgariaBurma/MyanmarCabo VerdeCambodiaCameroonCanadaCaribbeanCentral AmericaChileChinaColombiaCongoCosta RicaCroatiaCubaCzechoslovakiaDenmarkDominicaDominican RepublicEastern AfricaEastern AsiaEastern EuropeEcuadorEgyptEl SalvadorEnglandEritreaEthiopiaEuropeFijiFranceGermanyGhanaGreeceGrenadaGuatemalaGuyanaHaitiHondurasHong KongHungaryIndiaIndonesiaIranIraqIrelandIsraelItalyJamaicaJapanJordanKazakhstanKenyaKoreaKuwaitLaosLatin AmericaLatviaLebanonLiberiaLithuaniaMalaysiaMexicoMiddle AfricaMoldovaMoroccoNepalNetherlandsNicaraguaNigeriaNorth AmericaNorth MacedoniaNorthern AfricaNorthern EuropeNorwayOceaniaPakistanPanamaPeruPhilippinesPolandPortugalRomaniaRussiaSaudi ArabiaScotlandSenegalSerbiaSierra LeoneSingaporeSomaliaSouth AfricaSouth AmericaSouth Central AsiaSouth Eastern AsiaSouthern EuropeSpainSri LankaSt. Vincent and the GrenadinesSudanSwedenSwitzerlandSyriaTaiwanThailandTrinidad and TobagoTurkeyUgandaUkraineUruguayUzbekistanVenezuelaVietnamWest IndiesWestern AfricaWestern AsiaWestern EuropeYemenZaireZimbabweAzores
Immigrants from Micronesia
Race
Ancestry
AfghanAfricanAlaska NativeAlaskan AthabascanAlbanianAleutAlsatianAmericanApacheArabArapahoArgentineanArmenianAssyrian/Chaldean/SyriacAustralianAustrianBahamianBangladeshiBarbadianBasqueBelgianBelizeanBermudanBhutaneseBlackfeetBolivianBrazilianBritishBritish West IndianBulgarianBurmeseCajunCambodianCanadianCape VerdeanCarpatho RusynCelticCentral AmericanCentral American IndianCherokeeCheyenneChickasawChileanChineseChippewaChoctawColombianColvilleComancheCosta RicanCreeCreekCroatianCrowCubanCypriotCzechCzechoslovakianDanishDelawareDominicanDutchDutch West IndianEastern EuropeanEcuadorianEgyptianEnglishEstonianEthiopianEuropeanFijianFilipinoFinnishFrenchFrench American IndianFrench CanadianGermanGerman RussianGhanaianGreekGuamanian/ChamorroGuatemalanGuyaneseHaitianHmongHonduranHopiHoumaHungarianIcelanderIndian (Asian)IndonesianInupiatIranianIraqiIrishIroquoisIsraeliItalianJamaicanJapaneseJordanianKenyanKiowaKoreanLaotianLatvianLebaneseLiberianLithuanianLumbeeLuxembourgerMacedonianMalaysianMalteseMarshalleseMenomineeMexicanMexican American IndianMongolianMoroccanNative HawaiianNavajoNepaleseNew ZealanderNicaraguanNigerianNorthern EuropeanNorwegianOkinawanOsageOttawaPaiutePakistaniPalestinianPanamanianParaguayanPennsylvania GermanPeruvianPimaPolishPortuguesePotawatomiPuebloPuerto RicanPuget Sound SalishRomanianRussianSalvadoranSamoanScandinavianScotch-IrishScottishSeminoleSenegaleseSerbianShoshoneSierra LeoneanSiouxSlavicSlovakSloveneSomaliSouth AfricanSouth AmericanSouth American IndianSoviet UnionSpaniardSpanishSpanish AmericanSpanish American IndianSri LankanSubsaharan AfricanSudaneseSwedishSwissSyrianTaiwaneseThaiTohono O'OdhamTonganTrinidadian and TobagonianTsimshianTurkishU.S. Virgin IslanderUgandanUkrainianUruguayanUteVenezuelanVietnameseWelshWest IndianYakamaYaquiYugoslavianYumanYup'ikZimbabwean
Immigration
NonimmigrantsImmigrantsAfghanistanAfricaAlbaniaArgentinaArmeniaAsiaAustraliaAustriaBahamasBangladeshBarbadosBelarusBelgiumBelizeBoliviaBosnia and HerzegovinaBrazilBulgariaBurma/MyanmarCabo VerdeCambodiaCameroonCanadaCaribbeanCentral AmericaChileChinaColombiaCongoCosta RicaCroatiaCubaCzechoslovakiaDenmarkDominicaDominican RepublicEastern AfricaEastern AsiaEastern EuropeEcuadorEgyptEl SalvadorEnglandEritreaEthiopiaEuropeFijiFranceGermanyGhanaGreeceGrenadaGuatemalaGuyanaHaitiHondurasHong KongHungaryIndiaIndonesiaIranIraqIrelandIsraelItalyJamaicaJapanJordanKazakhstanKenyaKoreaKuwaitLaosLatin AmericaLatviaLebanonLiberiaLithuaniaMalaysiaMexicoMicronesiaMiddle AfricaMoldovaMoroccoNepalNetherlandsNicaraguaNigeriaNorth AmericaNorth MacedoniaNorthern AfricaNorthern EuropeNorwayOceaniaPakistanPanamaPeruPhilippinesPolandPortugalRomaniaRussiaSaudi ArabiaScotlandSenegalSerbiaSierra LeoneSingaporeSomaliaSouth AfricaSouth AmericaSouth Central AsiaSouth Eastern AsiaSouthern EuropeSpainSri LankaSt. Vincent and the GrenadinesSudanSwedenSwitzerlandSyriaTaiwanThailandTrinidad and TobagoTurkeyUgandaUkraineUruguayUzbekistanVenezuelaVietnamWest IndiesWestern AfricaWestern AsiaWestern EuropeYemenZaireZimbabweAzores
Unemployment Among Ages 65 to 74 years
Income
Poverty
Unemployment
Labor Participation
Family Structure
Vehicle Availability
Education Level
Disability

Unemployment Among Ages 65 to 74 years Comparison

Tlingit-Haida

Immigrants from Micronesia

Tragic
Tragic
6.5%
UNEMPLOYMENT AMONG AGES 65 TO 74 YEARS
0.0/ 100
METRIC RATING
338th/ 347
METRIC RANK
5.6%
UNEMPLOYMENT AMONG AGES 65 TO 74 YEARS
0.9/ 100
METRIC RATING
244th/ 347
METRIC RANK

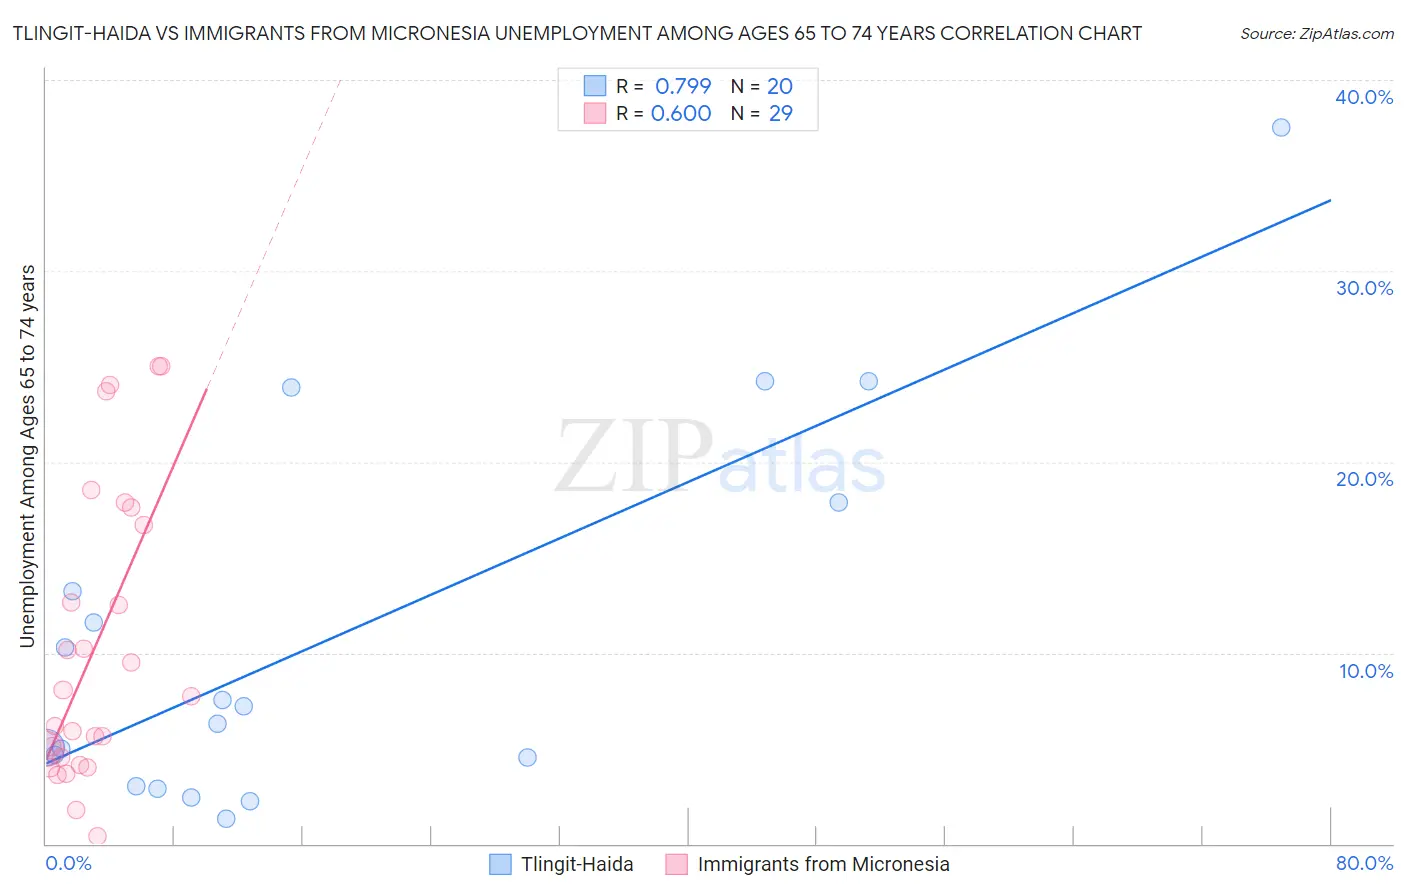
Tlingit-Haida vs Immigrants from Micronesia Unemployment Among Ages 65 to 74 years Correlation Chart

The statistical analysis conducted on geographies consisting of 57,234,908 people shows a strong positive correlation between the proportion of Tlingit-Haida and unemployment rate among population between the ages 65 and 74 in the United States with a correlation coefficient (R) of 0.799 and weighted average of 6.5%. Similarly, the statistical analysis conducted on geographies consisting of 58,028,119 people shows a significant positive correlation between the proportion of Immigrants from Micronesia and unemployment rate among population between the ages 65 and 74 in the United States with a correlation coefficient (R) of 0.600 and weighted average of 5.6%, a difference of 17.2%.
Tlingit-Haida vs Immigrants from Micronesia Unemployment Among Ages 65 to 74 years

Unemployment Among Ages 65 to 74 years Correlation Summary

MeasurementTlingit-HaidaImmigrants from Micronesia
Minimum1.3%0.40%
Maximum37.5%25.0%
Range36.2%24.6%
Mean10.7%10.3%
Median6.8%7.7%
Interquartile 25% (IQ1)3.7%4.3%
Interquartile 75% (IQ3)15.5%17.1%
Interquartile Range (IQR)11.8%12.8%
Standard Deviation (Sample)9.9%7.5%
Standard Deviation (Population)9.6%7.4%

Similar Demographics by Unemployment Among Ages 65 to 74 years

Demographics Similar to Tlingit-Haida by Unemployment Among Ages 65 to 74 years

In terms of unemployment among ages 65 to 74 years, the demographic groups most similar to Tlingit-Haida are Ute (6.5%, a difference of 0.10%), Yakama (6.6%, a difference of 0.36%), Immigrants from Armenia (6.5%, a difference of 0.85%), Pima (6.6%, a difference of 1.2%), and Puerto Rican (6.4%, a difference of 2.5%).
DemographicsRating | RankUnemployment Among Ages 65 to 74 years
Bermudans
0.0
/100
|
#331
Tragic
6.3%
Immigrants | Dominican Republic
0.0
/100
|
#332
Tragic
6.3%
Paiute
0.0
/100
|
#333
Tragic
6.3%
Taiwanese
0.0
/100
|
#334
Tragic
6.3%
Puerto Ricans
0.0
/100
|
#335
Tragic
6.4%
Immigrants | Armenia
0.0
/100
|
#336
Tragic
6.5%
Ute
0.0
/100
|
#337
Tragic
6.5%
Tlingit-Haida
0.0
/100
|
#338
Tragic
6.5%
Yakama
0.0
/100
|
#339
Tragic
6.6%
Pima
0.0
/100
|
#340
Tragic
6.6%
Alaska Natives
0.0
/100
|
#341
Tragic
6.8%
Navajo
0.0
/100
|
#342
Tragic
6.9%
Alaskan Athabascans
0.0
/100
|
#343
Tragic
7.4%
Inupiat
0.0
/100
|
#344
Tragic
7.5%
Immigrants | Yemen
0.0
/100
|
#345
Tragic
8.3%

Demographics Similar to Immigrants from Micronesia by Unemployment Among Ages 65 to 74 years

In terms of unemployment among ages 65 to 74 years, the demographic groups most similar to Immigrants from Micronesia are Immigrants from Greece (5.6%, a difference of 0.0%), Paraguayan (5.6%, a difference of 0.010%), Immigrants (5.6%, a difference of 0.060%), Immigrants from Argentina (5.6%, a difference of 0.060%), and Trinidadian and Tobagonian (5.6%, a difference of 0.13%).
DemographicsRating | RankUnemployment Among Ages 65 to 74 years
Immigrants | Belize
2.2
/100
|
#237
Tragic
5.5%
Cajuns
1.8
/100
|
#238
Tragic
5.5%
German Russians
1.6
/100
|
#239
Tragic
5.5%
Ghanaians
1.4
/100
|
#240
Tragic
5.6%
Cree
1.4
/100
|
#241
Tragic
5.6%
Immigrants | Ghana
1.4
/100
|
#242
Tragic
5.6%
Immigrants | Peru
1.3
/100
|
#243
Tragic
5.6%
Immigrants | Micronesia
0.9
/100
|
#244
Tragic
5.6%
Immigrants | Greece
0.9
/100
|
#245
Tragic
5.6%
Paraguayans
0.9
/100
|
#246
Tragic
5.6%
Immigrants | Immigrants
0.9
/100
|
#247
Tragic
5.6%
Immigrants | Argentina
0.9
/100
|
#248
Tragic
5.6%
Trinidadians and Tobagonians
0.8
/100
|
#249
Tragic
5.6%
Cape Verdeans
0.7
/100
|
#250
Tragic
5.6%
Brazilians
0.5
/100
|
#251
Tragic
5.6%