Taiwanese vs Marshallese Unemployment Among Seniors over 65 years
COMPARE
Taiwanese
Marshallese
Unemployment Among Seniors over 65 years
Unemployment Among Seniors over 65 years Comparison
Taiwanese
Marshallese
6.0%
UNEMPLOYMENT AMONG SENIORS OVER 65 YEARS
0.0/ 100
METRIC RATING
331st/ 347
METRIC RANK
5.3%
UNEMPLOYMENT AMONG SENIORS OVER 65 YEARS
3.1/ 100
METRIC RATING
233rd/ 347
METRIC RANK
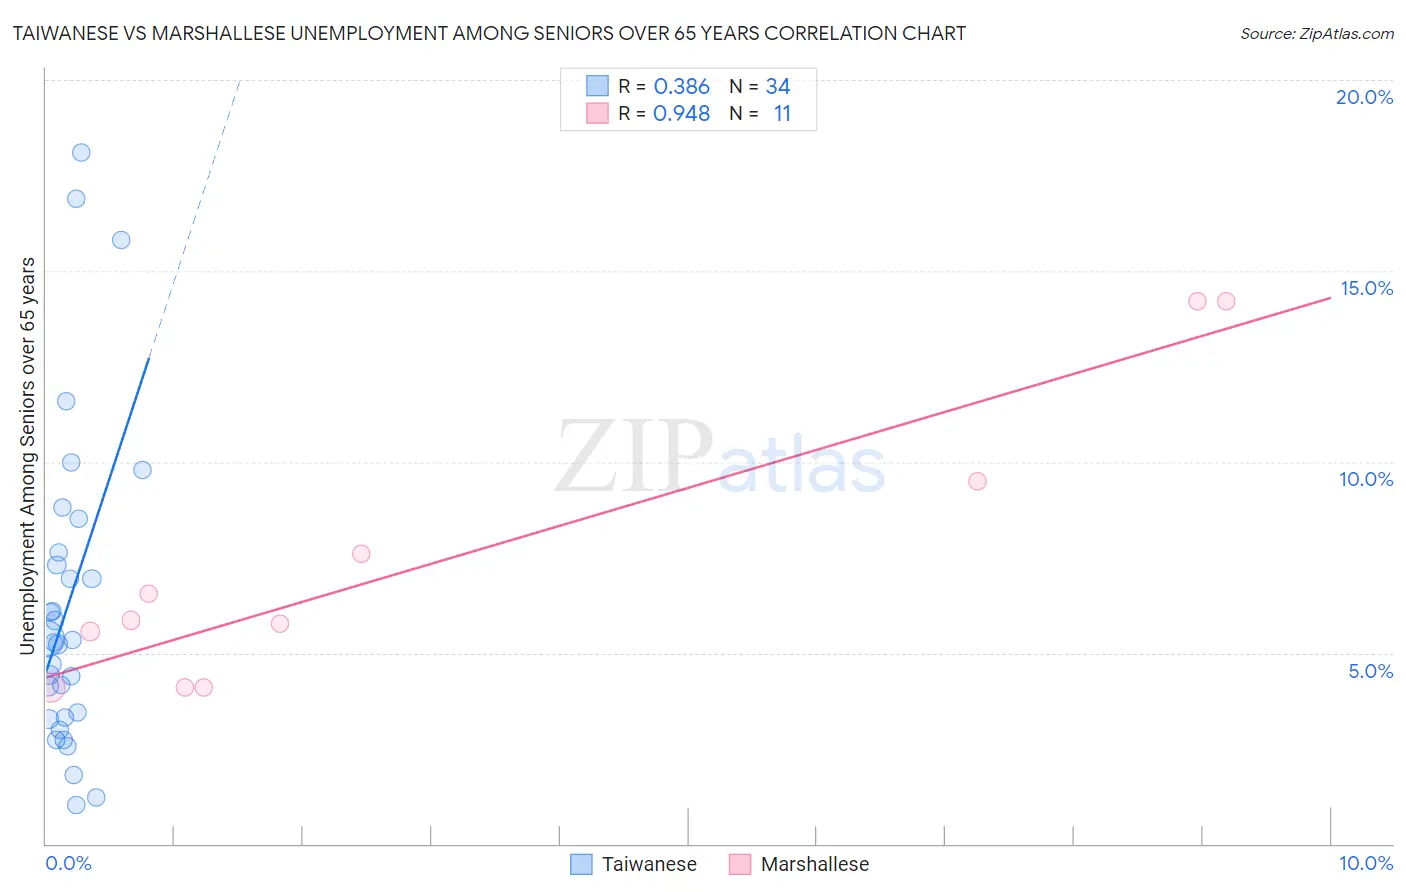
Taiwanese vs Marshallese Unemployment Among Seniors over 65 years Correlation Chart
The statistical analysis conducted on geographies consisting of 31,497,797 people shows a mild positive correlation between the proportion of Taiwanese and unemployment rate amomg seniors over the age of 65 in the United States with a correlation coefficient (R) of 0.386 and weighted average of 6.0%. Similarly, the statistical analysis conducted on geographies consisting of 14,371,080 people shows a near-perfect positive correlation between the proportion of Marshallese and unemployment rate amomg seniors over the age of 65 in the United States with a correlation coefficient (R) of 0.948 and weighted average of 5.3%, a difference of 12.9%.
Unemployment Among Seniors over 65 years Correlation Summary
| Measurement | Taiwanese | Marshallese |
| Minimum | 1.0% | 4.1% |
| Maximum | 18.1% | 14.2% |
| Range | 17.1% | 10.1% |
| Mean | 6.3% | 7.4% |
| Median | 5.3% | 5.9% |
| Interquartile 25% (IQ1) | 3.3% | 4.1% |
| Interquartile 75% (IQ3) | 7.6% | 9.5% |
| Interquartile Range (IQR) | 4.3% | 5.4% |
| Standard Deviation (Sample) | 4.2% | 3.7% |
| Standard Deviation (Population) | 4.1% | 3.6% |
Similar Demographics by Unemployment Among Seniors over 65 years
Demographics Similar to Taiwanese by Unemployment Among Seniors over 65 years
In terms of unemployment among seniors over 65 years, the demographic groups most similar to Taiwanese are Aleut (6.0%, a difference of 0.050%), Immigrants from Portugal (6.0%, a difference of 0.15%), Dominican (6.0%, a difference of 0.17%), Immigrants from Dominican Republic (6.0%, a difference of 0.60%), and Puerto Rican (5.9%, a difference of 0.92%).
| Demographics | Rating | Rank | Unemployment Among Seniors over 65 years |
| Yuman | 0.0 /100 | #324 | Tragic 5.8% |
| Inupiat | 0.0 /100 | #325 | Tragic 5.8% |
| Shoshone | 0.0 /100 | #326 | Tragic 5.9% |
| Bermudans | 0.0 /100 | #327 | Tragic 5.9% |
| Puerto Ricans | 0.0 /100 | #328 | Tragic 5.9% |
| Dominicans | 0.0 /100 | #329 | Tragic 6.0% |
| Immigrants | Portugal | 0.0 /100 | #330 | Tragic 6.0% |
| Taiwanese | 0.0 /100 | #331 | Tragic 6.0% |
| Aleuts | 0.0 /100 | #332 | Tragic 6.0% |
| Immigrants | Dominican Republic | 0.0 /100 | #333 | Tragic 6.0% |
| Tohono O'odham | 0.0 /100 | #334 | Tragic 6.1% |
| Immigrants | Armenia | 0.0 /100 | #335 | Tragic 6.2% |
| Pima | 0.0 /100 | #336 | Tragic 6.3% |
| Alaska Natives | 0.0 /100 | #337 | Tragic 6.3% |
| Immigrants | Azores | 0.0 /100 | #338 | Tragic 6.3% |
Demographics Similar to Marshallese by Unemployment Among Seniors over 65 years
In terms of unemployment among seniors over 65 years, the demographic groups most similar to Marshallese are Blackfeet (5.3%, a difference of 0.0%), Hopi (5.3%, a difference of 0.090%), Immigrants from Albania (5.3%, a difference of 0.10%), Hungarian (5.3%, a difference of 0.17%), and Immigrants from Argentina (5.3%, a difference of 0.20%).
| Demographics | Rating | Rank | Unemployment Among Seniors over 65 years |
| Immigrants | Croatia | 5.3 /100 | #226 | Tragic 5.3% |
| French American Indians | 5.2 /100 | #227 | Tragic 5.3% |
| Haitians | 4.4 /100 | #228 | Tragic 5.3% |
| Samoans | 4.2 /100 | #229 | Tragic 5.3% |
| Immigrants | Argentina | 4.0 /100 | #230 | Tragic 5.3% |
| Hungarians | 3.9 /100 | #231 | Tragic 5.3% |
| Hopi | 3.5 /100 | #232 | Tragic 5.3% |
| Marshallese | 3.1 /100 | #233 | Tragic 5.3% |
| Blackfeet | 3.1 /100 | #234 | Tragic 5.3% |
| Immigrants | Albania | 2.7 /100 | #235 | Tragic 5.3% |
| Immigrants | Costa Rica | 2.1 /100 | #236 | Tragic 5.3% |
| Immigrants | Greece | 2.0 /100 | #237 | Tragic 5.3% |
| Immigrants | Israel | 2.0 /100 | #238 | Tragic 5.3% |
| Immigrants | Senegal | 1.8 /100 | #239 | Tragic 5.3% |
| Immigrants | Trinidad and Tobago | 1.6 /100 | #240 | Tragic 5.3% |