Taiwanese vs Central American Indian Unemployment Among Ages 55 to 59 years
COMPARE
Taiwanese
Central American Indian
Unemployment Among Ages 55 to 59 years
Unemployment Among Ages 55 to 59 years Comparison
Taiwanese
Central American Indians
4.6%
UNEMPLOYMENT AMONG AGES 55 TO 59 YEARS
97.9/ 100
METRIC RATING
81st/ 347
METRIC RANK
5.6%
UNEMPLOYMENT AMONG AGES 55 TO 59 YEARS
0.0/ 100
METRIC RATING
313th/ 347
METRIC RANK
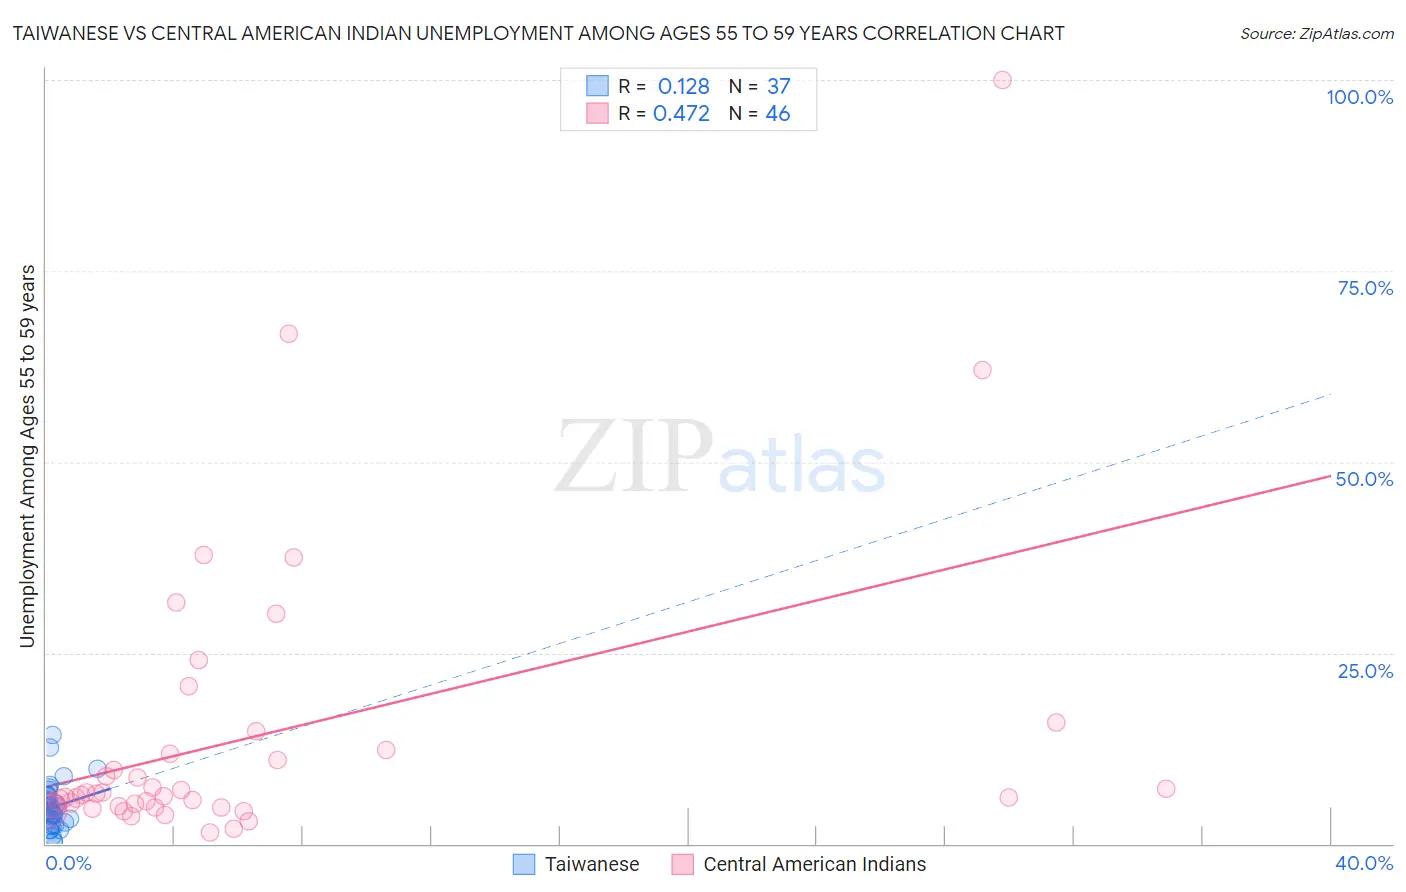
Taiwanese vs Central American Indian Unemployment Among Ages 55 to 59 years Correlation Chart
The statistical analysis conducted on geographies consisting of 31,568,879 people shows a poor positive correlation between the proportion of Taiwanese and unemployment rate among population between the ages 55 and 59 in the United States with a correlation coefficient (R) of 0.128 and weighted average of 4.6%. Similarly, the statistical analysis conducted on geographies consisting of 309,997,703 people shows a moderate positive correlation between the proportion of Central American Indians and unemployment rate among population between the ages 55 and 59 in the United States with a correlation coefficient (R) of 0.472 and weighted average of 5.6%, a difference of 21.9%.
Unemployment Among Ages 55 to 59 years Correlation Summary
| Measurement | Taiwanese | Central American Indian |
| Minimum | 0.40% | 1.4% |
| Maximum | 14.3% | 100.0% |
| Range | 13.9% | 98.6% |
| Mean | 4.8% | 14.2% |
| Median | 4.3% | 6.5% |
| Interquartile 25% (IQ1) | 2.6% | 4.9% |
| Interquartile 75% (IQ3) | 6.2% | 12.2% |
| Interquartile Range (IQR) | 3.5% | 7.3% |
| Standard Deviation (Sample) | 3.0% | 19.3% |
| Standard Deviation (Population) | 3.0% | 19.1% |
Similar Demographics by Unemployment Among Ages 55 to 59 years
Demographics Similar to Taiwanese by Unemployment Among Ages 55 to 59 years
In terms of unemployment among ages 55 to 59 years, the demographic groups most similar to Taiwanese are Latvian (4.6%, a difference of 0.050%), Cambodian (4.6%, a difference of 0.070%), Sri Lankan (4.6%, a difference of 0.11%), Lebanese (4.6%, a difference of 0.17%), and Finnish (4.6%, a difference of 0.20%).
| Demographics | Rating | Rank | Unemployment Among Ages 55 to 59 years |
| Croatians | 98.5 /100 | #74 | Exceptional 4.6% |
| Immigrants | Iraq | 98.5 /100 | #75 | Exceptional 4.6% |
| Immigrants | Bosnia and Herzegovina | 98.3 /100 | #76 | Exceptional 4.6% |
| Scotch-Irish | 98.3 /100 | #77 | Exceptional 4.6% |
| Finns | 98.2 /100 | #78 | Exceptional 4.6% |
| Sri Lankans | 98.1 /100 | #79 | Exceptional 4.6% |
| Cambodians | 98.0 /100 | #80 | Exceptional 4.6% |
| Taiwanese | 97.9 /100 | #81 | Exceptional 4.6% |
| Latvians | 97.8 /100 | #82 | Exceptional 4.6% |
| Lebanese | 97.5 /100 | #83 | Exceptional 4.6% |
| Malaysians | 96.9 /100 | #84 | Exceptional 4.7% |
| Immigrants | Vietnam | 96.9 /100 | #85 | Exceptional 4.7% |
| Immigrants | Colombia | 96.9 /100 | #86 | Exceptional 4.7% |
| Poles | 96.9 /100 | #87 | Exceptional 4.7% |
| Immigrants | Cameroon | 96.9 /100 | #88 | Exceptional 4.7% |
Demographics Similar to Central American Indians by Unemployment Among Ages 55 to 59 years
In terms of unemployment among ages 55 to 59 years, the demographic groups most similar to Central American Indians are Ecuadorian (5.6%, a difference of 0.19%), Tlingit-Haida (5.7%, a difference of 0.29%), Houma (5.6%, a difference of 0.41%), Guyanese (5.7%, a difference of 0.44%), and Belizean (5.6%, a difference of 0.58%).
| Demographics | Rating | Rank | Unemployment Among Ages 55 to 59 years |
| Immigrants | Cabo Verde | 0.0 /100 | #306 | Tragic 5.5% |
| Immigrants | Belize | 0.0 /100 | #307 | Tragic 5.5% |
| Spanish American Indians | 0.0 /100 | #308 | Tragic 5.6% |
| Nepalese | 0.0 /100 | #309 | Tragic 5.6% |
| Belizeans | 0.0 /100 | #310 | Tragic 5.6% |
| Houma | 0.0 /100 | #311 | Tragic 5.6% |
| Ecuadorians | 0.0 /100 | #312 | Tragic 5.6% |
| Central American Indians | 0.0 /100 | #313 | Tragic 5.6% |
| Tlingit-Haida | 0.0 /100 | #314 | Tragic 5.7% |
| Guyanese | 0.0 /100 | #315 | Tragic 5.7% |
| Immigrants | Ecuador | 0.0 /100 | #316 | Tragic 5.7% |
| Hmong | 0.0 /100 | #317 | Tragic 5.7% |
| Immigrants | Guyana | 0.0 /100 | #318 | Tragic 5.8% |
| Kiowa | 0.0 /100 | #319 | Tragic 5.8% |
| Immigrants | Azores | 0.0 /100 | #320 | Tragic 5.8% |