Syrian vs Yaqui Unemployment Among Ages 16 to 19 years

COMPARE

Syrian
Race
Ancestry
AfghanAfricanAlaska NativeAlaskan AthabascanAlbanianAleutAlsatianAmericanApacheArabArapahoArgentineanArmenianAssyrian/Chaldean/SyriacAustralianAustrianBahamianBangladeshiBarbadianBasqueBelgianBelizeanBermudanBhutaneseBlackfeetBolivianBrazilianBritishBritish West IndianBulgarianBurmeseCajunCambodianCanadianCape VerdeanCarpatho RusynCelticCentral AmericanCentral American IndianCherokeeCheyenneChickasawChileanChineseChippewaChoctawColombianColvilleComancheCosta RicanCreeCreekCroatianCrowCubanCypriotCzechCzechoslovakianDanishDelawareDominicanDutchDutch West IndianEastern EuropeanEcuadorianEgyptianEnglishEstonianEthiopianEuropeanFijianFilipinoFinnishFrenchFrench American IndianFrench CanadianGermanGerman RussianGhanaianGreekGuamanian/ChamorroGuatemalanGuyaneseHaitianHmongHonduranHopiHoumaHungarianIcelanderIndian (Asian)IndonesianInupiatIranianIraqiIrishIroquoisIsraeliItalianJamaicanJapaneseJordanianKenyanKiowaKoreanLaotianLatvianLebaneseLiberianLithuanianLumbeeLuxembourgerMacedonianMalaysianMalteseMarshalleseMenomineeMexicanMexican American IndianMongolianMoroccanNative HawaiianNavajoNepaleseNew ZealanderNicaraguanNigerianNorthern EuropeanNorwegianOkinawanOsageOttawaPaiutePakistaniPalestinianPanamanianParaguayanPennsylvania GermanPeruvianPimaPolishPortuguesePotawatomiPuebloPuerto RicanPuget Sound SalishRomanianRussianSalvadoranSamoanScandinavianScotch-IrishScottishSeminoleSenegaleseSerbianShoshoneSierra LeoneanSiouxSlavicSlovakSloveneSomaliSouth AfricanSouth AmericanSouth American IndianSoviet UnionSpaniardSpanishSpanish AmericanSpanish American IndianSri LankanSubsaharan AfricanSudaneseSwedishSwissSyrianTaiwaneseThaiTlingit-HaidaTohono O'OdhamTonganTrinidadian and TobagonianTsimshianTurkishU.S. Virgin IslanderUgandanUkrainianUruguayanUteVenezuelanVietnameseWelshWest IndianYakamaYugoslavianYumanYup'ikZimbabwean
Immigration
NonimmigrantsImmigrantsAfghanistanAfricaAlbaniaArgentinaArmeniaAsiaAustraliaAustriaBahamasBangladeshBarbadosBelarusBelgiumBelizeBoliviaBosnia and HerzegovinaBrazilBulgariaBurma/MyanmarCabo VerdeCambodiaCameroonCanadaCaribbeanCentral AmericaChileChinaColombiaCongoCosta RicaCroatiaCubaCzechoslovakiaDenmarkDominicaDominican RepublicEastern AfricaEastern AsiaEastern EuropeEcuadorEgyptEl SalvadorEnglandEritreaEthiopiaEuropeFijiFranceGermanyGhanaGreeceGrenadaGuatemalaGuyanaHaitiHondurasHong KongHungaryIndiaIndonesiaIranIraqIrelandIsraelItalyJamaicaJapanJordanKazakhstanKenyaKoreaKuwaitLaosLatin AmericaLatviaLebanonLiberiaLithuaniaMalaysiaMexicoMicronesiaMiddle AfricaMoldovaMoroccoNepalNetherlandsNicaraguaNigeriaNorth AmericaNorth MacedoniaNorthern AfricaNorthern EuropeNorwayOceaniaPakistanPanamaPeruPhilippinesPolandPortugalRomaniaRussiaSaudi ArabiaScotlandSenegalSerbiaSierra LeoneSingaporeSomaliaSouth AfricaSouth AmericaSouth Central AsiaSouth Eastern AsiaSouthern EuropeSpainSri LankaSt. Vincent and the GrenadinesSudanSwedenSwitzerlandSyriaTaiwanThailandTrinidad and TobagoTurkeyUgandaUkraineUruguayUzbekistanVenezuelaVietnamWest IndiesWestern AfricaWestern AsiaWestern EuropeYemenZaireZimbabweAzores
Yaqui
Race
Ancestry
AfghanAfricanAlaska NativeAlaskan AthabascanAlbanianAleutAlsatianAmericanApacheArabArapahoArgentineanArmenianAssyrian/Chaldean/SyriacAustralianAustrianBahamianBangladeshiBarbadianBasqueBelgianBelizeanBermudanBhutaneseBlackfeetBolivianBrazilianBritishBritish West IndianBulgarianBurmeseCajunCambodianCanadianCape VerdeanCarpatho RusynCelticCentral AmericanCentral American IndianCherokeeCheyenneChickasawChileanChineseChippewaChoctawColombianColvilleComancheCosta RicanCreeCreekCroatianCrowCubanCypriotCzechCzechoslovakianDanishDelawareDominicanDutchDutch West IndianEastern EuropeanEcuadorianEgyptianEnglishEstonianEthiopianEuropeanFijianFilipinoFinnishFrenchFrench American IndianFrench CanadianGermanGerman RussianGhanaianGreekGuamanian/ChamorroGuatemalanGuyaneseHaitianHmongHonduranHopiHoumaHungarianIcelanderIndian (Asian)IndonesianInupiatIranianIraqiIrishIroquoisIsraeliItalianJamaicanJapaneseJordanianKenyanKiowaKoreanLaotianLatvianLebaneseLiberianLithuanianLumbeeLuxembourgerMacedonianMalaysianMalteseMarshalleseMenomineeMexicanMexican American IndianMongolianMoroccanNative HawaiianNavajoNepaleseNew ZealanderNicaraguanNigerianNorthern EuropeanNorwegianOkinawanOsageOttawaPaiutePakistaniPalestinianPanamanianParaguayanPennsylvania GermanPeruvianPimaPolishPortuguesePotawatomiPuebloPuerto RicanPuget Sound SalishRomanianRussianSalvadoranSamoanScandinavianScotch-IrishScottishSeminoleSenegaleseSerbianShoshoneSierra LeoneanSiouxSlavicSlovakSloveneSomaliSouth AfricanSouth AmericanSouth American IndianSoviet UnionSpaniardSpanishSpanish AmericanSpanish American IndianSri LankanSubsaharan AfricanSudaneseSwedishSwissTaiwaneseThaiTlingit-HaidaTohono O'OdhamTonganTrinidadian and TobagonianTsimshianTurkishU.S. Virgin IslanderUgandanUkrainianUruguayanUteVenezuelanVietnameseWelshWest IndianYakamaYaquiYugoslavianYumanYup'ikZimbabwean
Immigration
NonimmigrantsImmigrantsAfghanistanAfricaAlbaniaArgentinaArmeniaAsiaAustraliaAustriaBahamasBangladeshBarbadosBelarusBelgiumBelizeBoliviaBosnia and HerzegovinaBrazilBulgariaBurma/MyanmarCabo VerdeCambodiaCameroonCanadaCaribbeanCentral AmericaChileChinaColombiaCongoCosta RicaCroatiaCubaCzechoslovakiaDenmarkDominicaDominican RepublicEastern AfricaEastern AsiaEastern EuropeEcuadorEgyptEl SalvadorEnglandEritreaEthiopiaEuropeFijiFranceGermanyGhanaGreeceGrenadaGuatemalaGuyanaHaitiHondurasHong KongHungaryIndiaIndonesiaIranIraqIrelandIsraelItalyJamaicaJapanJordanKazakhstanKenyaKoreaKuwaitLaosLatin AmericaLatviaLebanonLiberiaLithuaniaMalaysiaMexicoMicronesiaMiddle AfricaMoldovaMoroccoNepalNetherlandsNicaraguaNigeriaNorth AmericaNorth MacedoniaNorthern AfricaNorthern EuropeNorwayOceaniaPakistanPanamaPeruPhilippinesPolandPortugalRomaniaRussiaSaudi ArabiaScotlandSenegalSerbiaSierra LeoneSingaporeSomaliaSouth AfricaSouth AmericaSouth Central AsiaSouth Eastern AsiaSouthern EuropeSpainSri LankaSt. Vincent and the GrenadinesSudanSwedenSwitzerlandSyriaTaiwanThailandTrinidad and TobagoTurkeyUgandaUkraineUruguayUzbekistanVenezuelaVietnamWest IndiesWestern AfricaWestern AsiaWestern EuropeYemenZaireZimbabweAzores
Unemployment Among Ages 16 to 19 years
Income
Poverty
Unemployment
Labor Participation
Family Structure
Vehicle Availability
Education Level
Disability

Unemployment Among Ages 16 to 19 years Comparison

Syrians

Yaqui

Excellent
Tragic
17.1%
UNEMPLOYMENT AMONG AGES 16 TO 19 YEARS
88.6/ 100
METRIC RATING
124th/ 347
METRIC RANK
19.0%
UNEMPLOYMENT AMONG AGES 16 TO 19 YEARS
0.1/ 100
METRIC RATING
264th/ 347
METRIC RANK

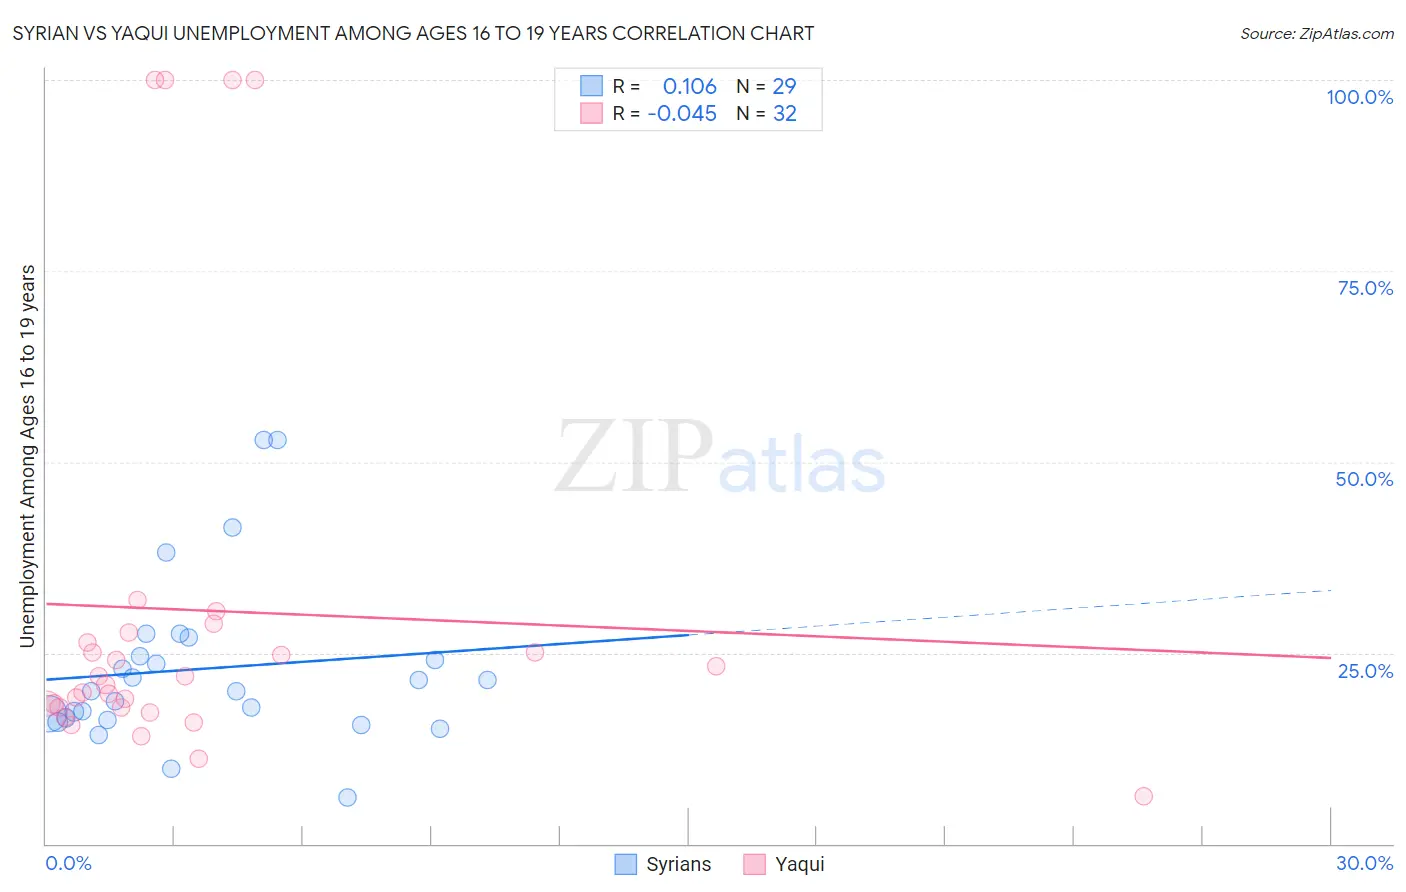
Syrian vs Yaqui Unemployment Among Ages 16 to 19 years Correlation Chart

The statistical analysis conducted on geographies consisting of 256,028,619 people shows a poor positive correlation between the proportion of Syrians and unemployment rate among population between the ages 16 and 19 in the United States with a correlation coefficient (R) of 0.106 and weighted average of 17.1%. Similarly, the statistical analysis conducted on geographies consisting of 105,605,513 people shows no correlation between the proportion of Yaqui and unemployment rate among population between the ages 16 and 19 in the United States with a correlation coefficient (R) of -0.045 and weighted average of 19.0%, a difference of 10.6%.
Syrian vs Yaqui Unemployment Among Ages 16 to 19 years

Unemployment Among Ages 16 to 19 years Correlation Summary

MeasurementSyrianYaqui
Minimum6.1%6.3%
Maximum52.9%100.0%
Range46.8%93.7%
Mean22.9%30.6%
Median20.0%21.3%
Interquartile 25% (IQ1)16.3%17.9%
Interquartile 75% (IQ3)25.7%27.0%
Interquartile Range (IQR)9.4%9.1%
Standard Deviation (Sample)11.0%27.2%
Standard Deviation (Population)10.8%26.8%

Similar Demographics by Unemployment Among Ages 16 to 19 years

Demographics Similar to Syrians by Unemployment Among Ages 16 to 19 years

In terms of unemployment among ages 16 to 19 years, the demographic groups most similar to Syrians are Immigrants from Laos (17.1%, a difference of 0.020%), Immigrants from Germany (17.2%, a difference of 0.11%), Immigrants from Bolivia (17.2%, a difference of 0.21%), Immigrants from South Eastern Asia (17.1%, a difference of 0.26%), and Immigrants from Moldova (17.1%, a difference of 0.28%).
DemographicsRating | RankUnemployment Among Ages 16 to 19 years
Immigrants | Sri Lanka
92.0
/100
|
#117
Exceptional
17.1%
Venezuelans
91.8
/100
|
#118
Exceptional
17.1%
Hungarians
91.6
/100
|
#119
Exceptional
17.1%
Immigrants | Middle Africa
90.9
/100
|
#120
Exceptional
17.1%
Immigrants | Moldova
90.7
/100
|
#121
Exceptional
17.1%
Immigrants | South Eastern Asia
90.7
/100
|
#122
Exceptional
17.1%
Immigrants | Laos
88.8
/100
|
#123
Excellent
17.1%
Syrians
88.6
/100
|
#124
Excellent
17.1%
Immigrants | Germany
87.7
/100
|
#125
Excellent
17.2%
Immigrants | Bolivia
86.7
/100
|
#126
Excellent
17.2%
Pakistanis
85.8
/100
|
#127
Excellent
17.2%
Australians
85.6
/100
|
#128
Excellent
17.2%
Creek
85.5
/100
|
#129
Excellent
17.2%
Immigrants | Indonesia
84.7
/100
|
#130
Excellent
17.2%
German Russians
84.1
/100
|
#131
Excellent
17.2%

Demographics Similar to Yaqui by Unemployment Among Ages 16 to 19 years

In terms of unemployment among ages 16 to 19 years, the demographic groups most similar to Yaqui are Choctaw (19.0%, a difference of 0.010%), Cree (19.0%, a difference of 0.030%), Immigrants from Honduras (19.0%, a difference of 0.10%), Salvadoran (18.9%, a difference of 0.16%), and Spanish American Indian (18.9%, a difference of 0.20%).
DemographicsRating | RankUnemployment Among Ages 16 to 19 years
Immigrants | Nigeria
0.2
/100
|
#257
Tragic
18.9%
Immigrants | Mexico
0.2
/100
|
#258
Tragic
18.9%
Immigrants | Central America
0.2
/100
|
#259
Tragic
18.9%
Nigerians
0.2
/100
|
#260
Tragic
18.9%
Spanish American Indians
0.1
/100
|
#261
Tragic
18.9%
Salvadorans
0.1
/100
|
#262
Tragic
18.9%
Cree
0.1
/100
|
#263
Tragic
19.0%
Yaqui
0.1
/100
|
#264
Tragic
19.0%
Choctaw
0.1
/100
|
#265
Tragic
19.0%
Immigrants | Honduras
0.1
/100
|
#266
Tragic
19.0%
Israelis
0.1
/100
|
#267
Tragic
19.0%
Immigrants | El Salvador
0.1
/100
|
#268
Tragic
19.1%
Lumbee
0.1
/100
|
#269
Tragic
19.1%
Hondurans
0.1
/100
|
#270
Tragic
19.2%
Blackfeet
0.0
/100
|
#271
Tragic
19.2%