Syrian vs Immigrants from Venezuela Unemployment Among Ages 60 to 64 years

COMPARE

Syrian
Race
Ancestry
AfghanAfricanAlaska NativeAlaskan AthabascanAlbanianAleutAlsatianAmericanApacheArabArapahoArgentineanArmenianAssyrian/Chaldean/SyriacAustralianAustrianBahamianBangladeshiBarbadianBasqueBelgianBelizeanBermudanBhutaneseBlackfeetBolivianBrazilianBritishBritish West IndianBulgarianBurmeseCajunCambodianCanadianCape VerdeanCarpatho RusynCelticCentral AmericanCentral American IndianCherokeeCheyenneChickasawChileanChineseChippewaChoctawColombianColvilleComancheCosta RicanCreeCreekCroatianCrowCubanCypriotCzechCzechoslovakianDanishDelawareDominicanDutchDutch West IndianEastern EuropeanEcuadorianEgyptianEnglishEstonianEthiopianEuropeanFijianFilipinoFinnishFrenchFrench American IndianFrench CanadianGermanGerman RussianGhanaianGreekGuamanian/ChamorroGuatemalanGuyaneseHaitianHmongHonduranHopiHoumaHungarianIcelanderIndian (Asian)IndonesianInupiatIranianIraqiIrishIroquoisIsraeliItalianJamaicanJapaneseJordanianKenyanKiowaKoreanLaotianLatvianLebaneseLiberianLithuanianLumbeeLuxembourgerMacedonianMalaysianMalteseMarshalleseMenomineeMexicanMexican American IndianMongolianMoroccanNative HawaiianNavajoNepaleseNew ZealanderNicaraguanNigerianNorthern EuropeanNorwegianOkinawanOsageOttawaPaiutePakistaniPalestinianPanamanianParaguayanPennsylvania GermanPeruvianPimaPolishPortuguesePotawatomiPuebloPuerto RicanPuget Sound SalishRomanianRussianSalvadoranSamoanScandinavianScotch-IrishScottishSeminoleSenegaleseSerbianShoshoneSierra LeoneanSiouxSlavicSlovakSloveneSomaliSouth AfricanSouth AmericanSouth American IndianSoviet UnionSpaniardSpanishSpanish AmericanSpanish American IndianSri LankanSubsaharan AfricanSudaneseSwedishSwissSyrianTaiwaneseThaiTlingit-HaidaTohono O'OdhamTonganTrinidadian and TobagonianTsimshianTurkishU.S. Virgin IslanderUgandanUkrainianUruguayanUteVenezuelanVietnameseWelshWest IndianYakamaYaquiYugoslavianYumanYup'ikZimbabwean
Immigration
NonimmigrantsImmigrantsAfghanistanAfricaAlbaniaArgentinaArmeniaAsiaAustraliaAustriaBahamasBangladeshBarbadosBelarusBelgiumBelizeBoliviaBosnia and HerzegovinaBrazilBulgariaBurma/MyanmarCabo VerdeCambodiaCameroonCanadaCaribbeanCentral AmericaChileChinaColombiaCongoCosta RicaCroatiaCubaCzechoslovakiaDenmarkDominicaDominican RepublicEastern AfricaEastern AsiaEastern EuropeEcuadorEgyptEl SalvadorEnglandEritreaEthiopiaEuropeFijiFranceGermanyGhanaGreeceGrenadaGuatemalaGuyanaHaitiHondurasHong KongHungaryIndiaIndonesiaIranIraqIrelandIsraelItalyJamaicaJapanJordanKazakhstanKenyaKoreaKuwaitLaosLatin AmericaLatviaLebanonLiberiaLithuaniaMalaysiaMexicoMicronesiaMiddle AfricaMoldovaMoroccoNepalNetherlandsNicaraguaNigeriaNorth AmericaNorth MacedoniaNorthern AfricaNorthern EuropeNorwayOceaniaPakistanPanamaPeruPhilippinesPolandPortugalRomaniaRussiaSaudi ArabiaScotlandSenegalSerbiaSierra LeoneSingaporeSomaliaSouth AfricaSouth AmericaSouth Central AsiaSouth Eastern AsiaSouthern EuropeSpainSri LankaSt. Vincent and the GrenadinesSudanSwedenSwitzerlandSyriaTaiwanThailandTrinidad and TobagoTurkeyUgandaUkraineUruguayUzbekistanVietnamWest IndiesWestern AfricaWestern AsiaWestern EuropeYemenZaireZimbabweAzores
Immigrants from Venezuela
Race
Ancestry
AfghanAfricanAlaska NativeAlaskan AthabascanAlbanianAleutAlsatianAmericanApacheArabArapahoArgentineanArmenianAssyrian/Chaldean/SyriacAustralianAustrianBahamianBangladeshiBarbadianBasqueBelgianBelizeanBermudanBhutaneseBlackfeetBolivianBrazilianBritishBritish West IndianBulgarianBurmeseCajunCambodianCanadianCape VerdeanCarpatho RusynCelticCentral AmericanCentral American IndianCherokeeCheyenneChickasawChileanChineseChippewaChoctawColombianColvilleComancheCosta RicanCreeCreekCroatianCrowCubanCypriotCzechCzechoslovakianDanishDelawareDominicanDutchDutch West IndianEastern EuropeanEcuadorianEgyptianEnglishEstonianEthiopianEuropeanFijianFilipinoFinnishFrenchFrench American IndianFrench CanadianGermanGerman RussianGhanaianGreekGuamanian/ChamorroGuatemalanGuyaneseHaitianHmongHonduranHopiHoumaHungarianIcelanderIndian (Asian)IndonesianInupiatIranianIraqiIrishIroquoisIsraeliItalianJamaicanJapaneseJordanianKenyanKiowaKoreanLaotianLatvianLebaneseLiberianLithuanianLumbeeLuxembourgerMacedonianMalaysianMalteseMarshalleseMenomineeMexicanMexican American IndianMongolianMoroccanNative HawaiianNavajoNepaleseNew ZealanderNicaraguanNigerianNorthern EuropeanNorwegianOkinawanOsageOttawaPaiutePakistaniPalestinianPanamanianParaguayanPennsylvania GermanPeruvianPimaPolishPortuguesePotawatomiPuebloPuerto RicanPuget Sound SalishRomanianRussianSalvadoranSamoanScandinavianScotch-IrishScottishSeminoleSenegaleseSerbianShoshoneSierra LeoneanSiouxSlavicSlovakSloveneSomaliSouth AfricanSouth AmericanSouth American IndianSoviet UnionSpaniardSpanishSpanish AmericanSpanish American IndianSri LankanSubsaharan AfricanSudaneseSwedishSwissTaiwaneseThaiTlingit-HaidaTohono O'OdhamTonganTrinidadian and TobagonianTsimshianTurkishU.S. Virgin IslanderUgandanUkrainianUruguayanUteVenezuelanVietnameseWelshWest IndianYakamaYaquiYugoslavianYumanYup'ikZimbabwean
Immigration
NonimmigrantsImmigrantsAfghanistanAfricaAlbaniaArgentinaArmeniaAsiaAustraliaAustriaBahamasBangladeshBarbadosBelarusBelgiumBelizeBoliviaBosnia and HerzegovinaBrazilBulgariaBurma/MyanmarCabo VerdeCambodiaCameroonCanadaCaribbeanCentral AmericaChileChinaColombiaCongoCosta RicaCroatiaCubaCzechoslovakiaDenmarkDominicaDominican RepublicEastern AfricaEastern AsiaEastern EuropeEcuadorEgyptEl SalvadorEnglandEritreaEthiopiaEuropeFijiFranceGermanyGhanaGreeceGrenadaGuatemalaGuyanaHaitiHondurasHong KongHungaryIndiaIndonesiaIranIraqIrelandIsraelItalyJamaicaJapanJordanKazakhstanKenyaKoreaKuwaitLaosLatin AmericaLatviaLebanonLiberiaLithuaniaMalaysiaMexicoMicronesiaMiddle AfricaMoldovaMoroccoNepalNetherlandsNicaraguaNigeriaNorth AmericaNorth MacedoniaNorthern AfricaNorthern EuropeNorwayOceaniaPakistanPanamaPeruPhilippinesPolandPortugalRomaniaRussiaSaudi ArabiaScotlandSenegalSerbiaSierra LeoneSingaporeSomaliaSouth AfricaSouth AmericaSouth Central AsiaSouth Eastern AsiaSouthern EuropeSpainSri LankaSt. Vincent and the GrenadinesSudanSwedenSwitzerlandSyriaTaiwanThailandTrinidad and TobagoTurkeyUgandaUkraineUruguayUzbekistanVenezuelaVietnamWest IndiesWestern AfricaWestern AsiaWestern EuropeYemenZaireZimbabweAzores
Unemployment Among Ages 60 to 64 years
Income
Poverty
Unemployment
Labor Participation
Family Structure
Vehicle Availability
Education Level
Disability

Unemployment Among Ages 60 to 64 years Comparison

Syrians

Immigrants from Venezuela

Exceptional
Exceptional
4.7%
UNEMPLOYMENT AMONG AGES 60 TO 64 YEARS
97.0/ 100
METRIC RATING
112th/ 347
METRIC RANK
4.5%
UNEMPLOYMENT AMONG AGES 60 TO 64 YEARS
100.0/ 100
METRIC RATING
30th/ 347
METRIC RANK

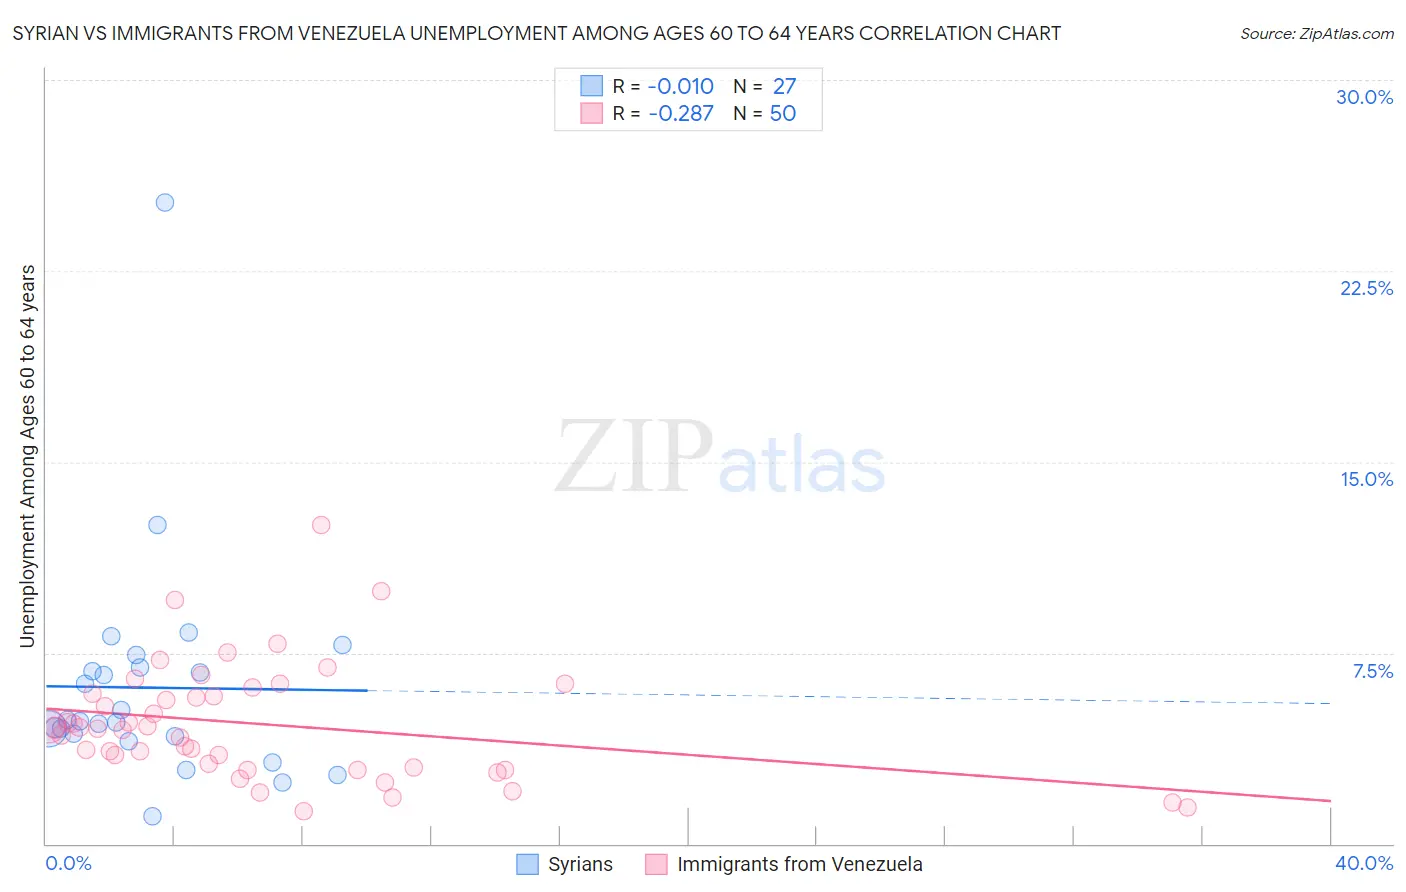
Syrian vs Immigrants from Venezuela Unemployment Among Ages 60 to 64 years Correlation Chart

The statistical analysis conducted on geographies consisting of 248,955,113 people shows no correlation between the proportion of Syrians and unemployment rate among population between the ages 60 and 64 in the United States with a correlation coefficient (R) of -0.010 and weighted average of 4.7%. Similarly, the statistical analysis conducted on geographies consisting of 269,107,059 people shows a weak negative correlation between the proportion of Immigrants from Venezuela and unemployment rate among population between the ages 60 and 64 in the United States with a correlation coefficient (R) of -0.287 and weighted average of 4.5%, a difference of 5.4%.
Syrian vs Immigrants from Venezuela Unemployment Among Ages 60 to 64 years

Unemployment Among Ages 60 to 64 years Correlation Summary

MeasurementSyrianImmigrants from Venezuela
Minimum1.1%1.3%
Maximum25.2%12.5%
Range24.1%11.2%
Mean6.1%4.7%
Median4.8%4.5%
Interquartile 25% (IQ1)4.2%3.0%
Interquartile 75% (IQ3)6.9%5.9%
Interquartile Range (IQR)2.7%2.9%
Standard Deviation (Sample)4.5%2.3%
Standard Deviation (Population)4.4%2.2%

Similar Demographics by Unemployment Among Ages 60 to 64 years

Demographics Similar to Syrians by Unemployment Among Ages 60 to 64 years

In terms of unemployment among ages 60 to 64 years, the demographic groups most similar to Syrians are French (4.7%, a difference of 0.040%), Ethiopian (4.7%, a difference of 0.090%), Bulgarian (4.7%, a difference of 0.12%), Maltese (4.7%, a difference of 0.12%), and Immigrants from Romania (4.7%, a difference of 0.15%).
DemographicsRating | RankUnemployment Among Ages 60 to 64 years
Canadians
97.7
/100
|
#105
Exceptional
4.7%
Immigrants | North America
97.6
/100
|
#106
Exceptional
4.7%
Greeks
97.5
/100
|
#107
Exceptional
4.7%
Immigrants | Japan
97.4
/100
|
#108
Exceptional
4.7%
Immigrants | Netherlands
97.4
/100
|
#109
Exceptional
4.7%
Ethiopians
97.2
/100
|
#110
Exceptional
4.7%
French
97.1
/100
|
#111
Exceptional
4.7%
Syrians
97.0
/100
|
#112
Exceptional
4.7%
Bulgarians
96.6
/100
|
#113
Exceptional
4.7%
Maltese
96.5
/100
|
#114
Exceptional
4.7%
Immigrants | Romania
96.4
/100
|
#115
Exceptional
4.7%
Immigrants | England
96.3
/100
|
#116
Exceptional
4.7%
Immigrants | Germany
96.3
/100
|
#117
Exceptional
4.7%
Ukrainians
96.1
/100
|
#118
Exceptional
4.7%
Immigrants | Morocco
95.7
/100
|
#119
Exceptional
4.7%

Demographics Similar to Immigrants from Venezuela by Unemployment Among Ages 60 to 64 years

In terms of unemployment among ages 60 to 64 years, the demographic groups most similar to Immigrants from Venezuela are Cuban (4.5%, a difference of 0.020%), Immigrants from Eritrea (4.5%, a difference of 0.070%), Zimbabwean (4.5%, a difference of 0.11%), Carpatho Rusyn (4.5%, a difference of 0.16%), and Immigrants from Nepal (4.5%, a difference of 0.25%).
DemographicsRating | RankUnemployment Among Ages 60 to 64 years
Immigrants | Zaire
100.0
/100
|
#23
Exceptional
4.4%
Immigrants | Burma/Myanmar
100.0
/100
|
#24
Exceptional
4.4%
Yugoslavians
100.0
/100
|
#25
Exceptional
4.4%
Czechs
100.0
/100
|
#26
Exceptional
4.4%
Immigrants | Iraq
100.0
/100
|
#27
Exceptional
4.5%
Immigrants | Nepal
100.0
/100
|
#28
Exceptional
4.5%
Cubans
100.0
/100
|
#29
Exceptional
4.5%
Immigrants | Venezuela
100.0
/100
|
#30
Exceptional
4.5%
Immigrants | Eritrea
100.0
/100
|
#31
Exceptional
4.5%
Zimbabweans
100.0
/100
|
#32
Exceptional
4.5%
Carpatho Rusyns
100.0
/100
|
#33
Exceptional
4.5%
Belgians
100.0
/100
|
#34
Exceptional
4.5%
Germans
100.0
/100
|
#35
Exceptional
4.5%
Venezuelans
100.0
/100
|
#36
Exceptional
4.5%
Immigrants | Portugal
100.0
/100
|
#37
Exceptional
4.5%