Syrian vs Immigrants from Guatemala Unemployment Among Ages 45 to 54 years

COMPARE

Syrian
Race
Ancestry
AfghanAfricanAlaska NativeAlaskan AthabascanAlbanianAleutAlsatianAmericanApacheArabArapahoArgentineanArmenianAssyrian/Chaldean/SyriacAustralianAustrianBahamianBangladeshiBarbadianBasqueBelgianBelizeanBermudanBhutaneseBlackfeetBolivianBrazilianBritishBritish West IndianBulgarianBurmeseCajunCambodianCanadianCape VerdeanCarpatho RusynCelticCentral AmericanCentral American IndianCherokeeCheyenneChickasawChileanChineseChippewaChoctawColombianColvilleComancheCosta RicanCreeCreekCroatianCrowCubanCypriotCzechCzechoslovakianDanishDelawareDominicanDutchDutch West IndianEastern EuropeanEcuadorianEgyptianEnglishEstonianEthiopianEuropeanFijianFilipinoFinnishFrenchFrench American IndianFrench CanadianGermanGerman RussianGhanaianGreekGuamanian/ChamorroGuatemalanGuyaneseHaitianHmongHonduranHopiHoumaHungarianIcelanderIndian (Asian)IndonesianInupiatIranianIraqiIrishIroquoisIsraeliItalianJamaicanJapaneseJordanianKenyanKiowaKoreanLaotianLatvianLebaneseLiberianLithuanianLumbeeLuxembourgerMacedonianMalaysianMalteseMarshalleseMenomineeMexicanMexican American IndianMongolianMoroccanNative HawaiianNavajoNepaleseNew ZealanderNicaraguanNigerianNorthern EuropeanNorwegianOkinawanOsageOttawaPaiutePakistaniPalestinianPanamanianParaguayanPennsylvania GermanPeruvianPimaPolishPortuguesePotawatomiPuebloPuerto RicanPuget Sound SalishRomanianRussianSalvadoranSamoanScandinavianScotch-IrishScottishSeminoleSenegaleseSerbianShoshoneSierra LeoneanSiouxSlavicSlovakSloveneSomaliSouth AfricanSouth AmericanSouth American IndianSoviet UnionSpaniardSpanishSpanish AmericanSpanish American IndianSri LankanSubsaharan AfricanSudaneseSwedishSwissSyrianTaiwaneseThaiTlingit-HaidaTohono O'OdhamTonganTrinidadian and TobagonianTsimshianTurkishU.S. Virgin IslanderUgandanUkrainianUruguayanUteVenezuelanVietnameseWelshWest IndianYakamaYaquiYugoslavianYumanYup'ikZimbabwean
Immigration
NonimmigrantsImmigrantsAfghanistanAfricaAlbaniaArgentinaArmeniaAsiaAustraliaAustriaBahamasBangladeshBarbadosBelarusBelgiumBelizeBoliviaBosnia and HerzegovinaBrazilBulgariaBurma/MyanmarCabo VerdeCambodiaCameroonCanadaCaribbeanCentral AmericaChileChinaColombiaCongoCosta RicaCroatiaCubaCzechoslovakiaDenmarkDominicaDominican RepublicEastern AfricaEastern AsiaEastern EuropeEcuadorEgyptEl SalvadorEnglandEritreaEthiopiaEuropeFijiFranceGermanyGhanaGreeceGrenadaGuyanaHaitiHondurasHong KongHungaryIndiaIndonesiaIranIraqIrelandIsraelItalyJamaicaJapanJordanKazakhstanKenyaKoreaKuwaitLaosLatin AmericaLatviaLebanonLiberiaLithuaniaMalaysiaMexicoMicronesiaMiddle AfricaMoldovaMoroccoNepalNetherlandsNicaraguaNigeriaNorth AmericaNorth MacedoniaNorthern AfricaNorthern EuropeNorwayOceaniaPakistanPanamaPeruPhilippinesPolandPortugalRomaniaRussiaSaudi ArabiaScotlandSenegalSerbiaSierra LeoneSingaporeSomaliaSouth AfricaSouth AmericaSouth Central AsiaSouth Eastern AsiaSouthern EuropeSpainSri LankaSt. Vincent and the GrenadinesSudanSwedenSwitzerlandSyriaTaiwanThailandTrinidad and TobagoTurkeyUgandaUkraineUruguayUzbekistanVenezuelaVietnamWest IndiesWestern AfricaWestern AsiaWestern EuropeYemenZaireZimbabweAzores
Immigrants from Guatemala
Race
Ancestry
AfghanAfricanAlaska NativeAlaskan AthabascanAlbanianAleutAlsatianAmericanApacheArabArapahoArgentineanArmenianAssyrian/Chaldean/SyriacAustralianAustrianBahamianBangladeshiBarbadianBasqueBelgianBelizeanBermudanBhutaneseBlackfeetBolivianBrazilianBritishBritish West IndianBulgarianBurmeseCajunCambodianCanadianCape VerdeanCarpatho RusynCelticCentral AmericanCentral American IndianCherokeeCheyenneChickasawChileanChineseChippewaChoctawColombianColvilleComancheCosta RicanCreeCreekCroatianCrowCubanCypriotCzechCzechoslovakianDanishDelawareDominicanDutchDutch West IndianEastern EuropeanEcuadorianEgyptianEnglishEstonianEthiopianEuropeanFijianFilipinoFinnishFrenchFrench American IndianFrench CanadianGermanGerman RussianGhanaianGreekGuamanian/ChamorroGuatemalanGuyaneseHaitianHmongHonduranHopiHoumaHungarianIcelanderIndian (Asian)IndonesianInupiatIranianIraqiIrishIroquoisIsraeliItalianJamaicanJapaneseJordanianKenyanKiowaKoreanLaotianLatvianLebaneseLiberianLithuanianLumbeeLuxembourgerMacedonianMalaysianMalteseMarshalleseMenomineeMexicanMexican American IndianMongolianMoroccanNative HawaiianNavajoNepaleseNew ZealanderNicaraguanNigerianNorthern EuropeanNorwegianOkinawanOsageOttawaPaiutePakistaniPalestinianPanamanianParaguayanPennsylvania GermanPeruvianPimaPolishPortuguesePotawatomiPuebloPuerto RicanPuget Sound SalishRomanianRussianSalvadoranSamoanScandinavianScotch-IrishScottishSeminoleSenegaleseSerbianShoshoneSierra LeoneanSiouxSlavicSlovakSloveneSomaliSouth AfricanSouth AmericanSouth American IndianSoviet UnionSpaniardSpanishSpanish AmericanSpanish American IndianSri LankanSubsaharan AfricanSudaneseSwedishSwissTaiwaneseThaiTlingit-HaidaTohono O'OdhamTonganTrinidadian and TobagonianTsimshianTurkishU.S. Virgin IslanderUgandanUkrainianUruguayanUteVenezuelanVietnameseWelshWest IndianYakamaYaquiYugoslavianYumanYup'ikZimbabwean
Immigration
NonimmigrantsImmigrantsAfghanistanAfricaAlbaniaArgentinaArmeniaAsiaAustraliaAustriaBahamasBangladeshBarbadosBelarusBelgiumBelizeBoliviaBosnia and HerzegovinaBrazilBulgariaBurma/MyanmarCabo VerdeCambodiaCameroonCanadaCaribbeanCentral AmericaChileChinaColombiaCongoCosta RicaCroatiaCubaCzechoslovakiaDenmarkDominicaDominican RepublicEastern AfricaEastern AsiaEastern EuropeEcuadorEgyptEl SalvadorEnglandEritreaEthiopiaEuropeFijiFranceGermanyGhanaGreeceGrenadaGuatemalaGuyanaHaitiHondurasHong KongHungaryIndiaIndonesiaIranIraqIrelandIsraelItalyJamaicaJapanJordanKazakhstanKenyaKoreaKuwaitLaosLatin AmericaLatviaLebanonLiberiaLithuaniaMalaysiaMexicoMicronesiaMiddle AfricaMoldovaMoroccoNepalNetherlandsNicaraguaNigeriaNorth AmericaNorth MacedoniaNorthern AfricaNorthern EuropeNorwayOceaniaPakistanPanamaPeruPhilippinesPolandPortugalRomaniaRussiaSaudi ArabiaScotlandSenegalSerbiaSierra LeoneSingaporeSomaliaSouth AfricaSouth AmericaSouth Central AsiaSouth Eastern AsiaSouthern EuropeSpainSri LankaSt. Vincent and the GrenadinesSudanSwedenSwitzerlandSyriaTaiwanThailandTrinidad and TobagoTurkeyUgandaUkraineUruguayUzbekistanVenezuelaVietnamWest IndiesWestern AfricaWestern AsiaWestern EuropeYemenZaireZimbabweAzores
Unemployment Among Ages 45 to 54 years
Income
Poverty
Unemployment
Labor Participation
Family Structure
Vehicle Availability
Education Level
Disability

Unemployment Among Ages 45 to 54 years Comparison

Syrians

Immigrants from Guatemala

Good
Tragic
4.5%
UNEMPLOYMENT AMONG AGES 45 TO 54 YEARS
77.3/ 100
METRIC RATING
146th/ 347
METRIC RANK
4.9%
UNEMPLOYMENT AMONG AGES 45 TO 54 YEARS
0.1/ 100
METRIC RATING
264th/ 347
METRIC RANK

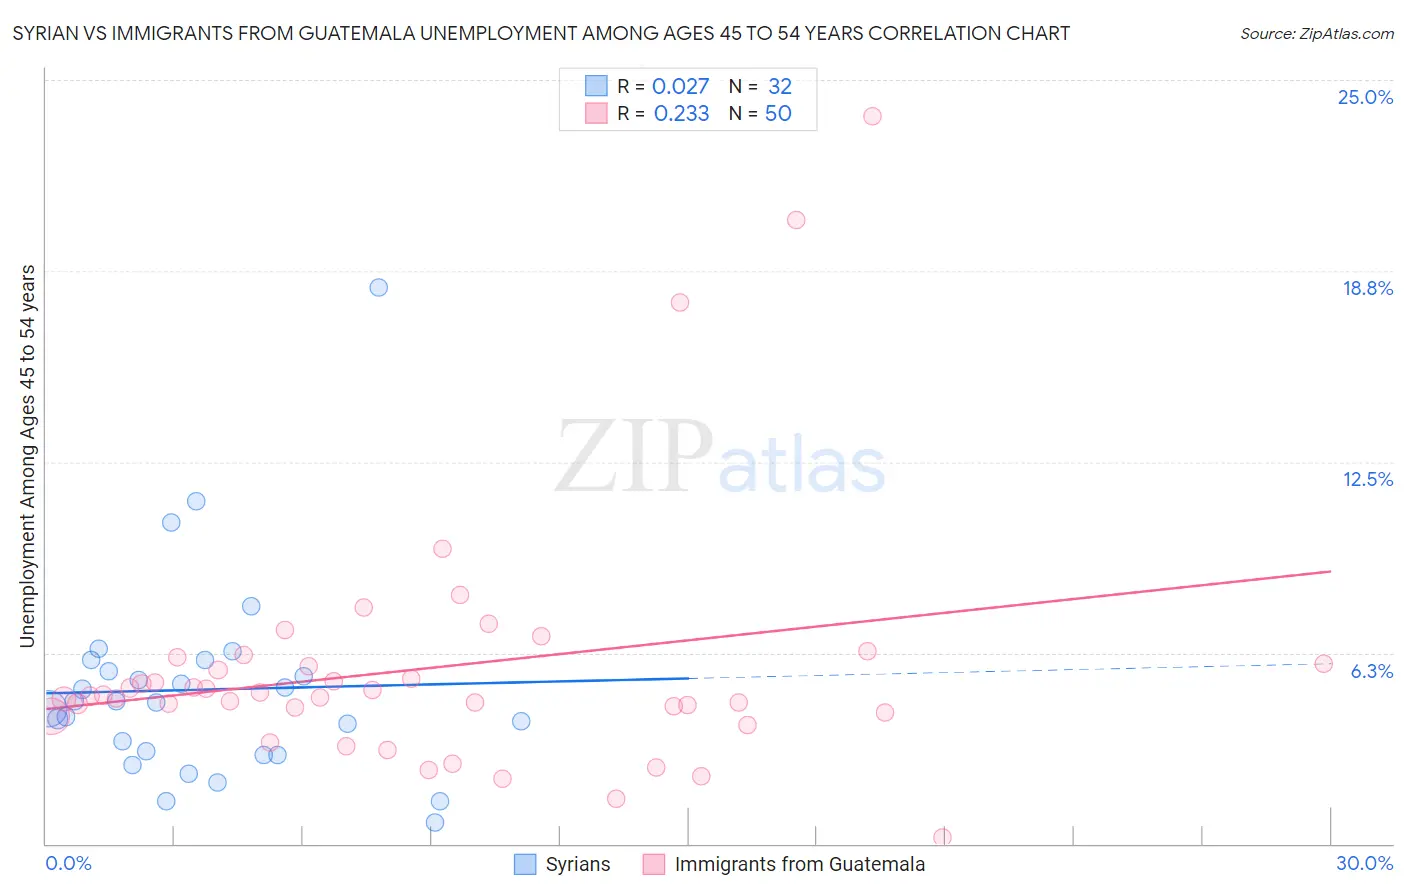
Syrian vs Immigrants from Guatemala Unemployment Among Ages 45 to 54 years Correlation Chart

The statistical analysis conducted on geographies consisting of 262,029,134 people shows no correlation between the proportion of Syrians and unemployment rate among population between the ages 45 and 54 in the United States with a correlation coefficient (R) of 0.027 and weighted average of 4.5%. Similarly, the statistical analysis conducted on geographies consisting of 369,612,271 people shows a weak positive correlation between the proportion of Immigrants from Guatemala and unemployment rate among population between the ages 45 and 54 in the United States with a correlation coefficient (R) of 0.233 and weighted average of 4.9%, a difference of 10.2%.
Syrian vs Immigrants from Guatemala Unemployment Among Ages 45 to 54 years

Unemployment Among Ages 45 to 54 years Correlation Summary

MeasurementSyrianImmigrants from Guatemala
Minimum0.70%0.20%
Maximum18.2%23.8%
Range17.5%23.6%
Mean5.0%5.7%
Median4.6%4.8%
Interquartile 25% (IQ1)3.0%4.3%
Interquartile 75% (IQ3)5.8%5.9%
Interquartile Range (IQR)2.9%1.6%
Standard Deviation (Sample)3.3%4.2%
Standard Deviation (Population)3.3%4.2%

Similar Demographics by Unemployment Among Ages 45 to 54 years

Demographics Similar to Syrians by Unemployment Among Ages 45 to 54 years

In terms of unemployment among ages 45 to 54 years, the demographic groups most similar to Syrians are Immigrants from Latvia (4.5%, a difference of 0.010%), Uruguayan (4.5%, a difference of 0.030%), Taiwanese (4.5%, a difference of 0.040%), Macedonian (4.5%, a difference of 0.12%), and Immigrants from Austria (4.5%, a difference of 0.13%).
DemographicsRating | RankUnemployment Among Ages 45 to 54 years
Immigrants | Kuwait
81.7
/100
|
#139
Excellent
4.4%
Immigrants | Zaire
80.7
/100
|
#140
Excellent
4.4%
Immigrants | Afghanistan
79.6
/100
|
#141
Good
4.4%
Immigrants | Netherlands
79.4
/100
|
#142
Good
4.4%
Macedonians
79.0
/100
|
#143
Good
4.5%
Taiwanese
77.9
/100
|
#144
Good
4.5%
Immigrants | Latvia
77.5
/100
|
#145
Good
4.5%
Syrians
77.3
/100
|
#146
Good
4.5%
Uruguayans
76.9
/100
|
#147
Good
4.5%
Immigrants | Austria
75.3
/100
|
#148
Good
4.5%
Costa Ricans
75.3
/100
|
#149
Good
4.5%
Tsimshian
74.6
/100
|
#150
Good
4.5%
Cypriots
74.4
/100
|
#151
Good
4.5%
Koreans
73.1
/100
|
#152
Good
4.5%
Hungarians
73.0
/100
|
#153
Good
4.5%

Demographics Similar to Immigrants from Guatemala by Unemployment Among Ages 45 to 54 years

In terms of unemployment among ages 45 to 54 years, the demographic groups most similar to Immigrants from Guatemala are Immigrants from Fiji (4.9%, a difference of 0.26%), Immigrants from Somalia (4.9%, a difference of 0.27%), Ghanaian (4.9%, a difference of 0.39%), Bahamian (4.9%, a difference of 0.48%), and Immigrants from Uzbekistan (4.9%, a difference of 0.57%).
DemographicsRating | RankUnemployment Among Ages 45 to 54 years
Immigrants | Western Africa
0.2
/100
|
#257
Tragic
4.9%
Sub-Saharan Africans
0.2
/100
|
#258
Tragic
4.9%
Ugandans
0.1
/100
|
#259
Tragic
4.9%
Mexican American Indians
0.1
/100
|
#260
Tragic
4.9%
Guatemalans
0.1
/100
|
#261
Tragic
4.9%
Mexicans
0.1
/100
|
#262
Tragic
4.9%
Immigrants | Fiji
0.1
/100
|
#263
Tragic
4.9%
Immigrants | Guatemala
0.1
/100
|
#264
Tragic
4.9%
Immigrants | Somalia
0.1
/100
|
#265
Tragic
4.9%
Ghanaians
0.0
/100
|
#266
Tragic
4.9%
Bahamians
0.0
/100
|
#267
Tragic
4.9%
Immigrants | Uzbekistan
0.0
/100
|
#268
Tragic
4.9%
Somalis
0.0
/100
|
#269
Tragic
5.0%
Immigrants | Ghana
0.0
/100
|
#270
Tragic
5.0%
Cajuns
0.0
/100
|
#271
Tragic
5.0%