Syrian vs Hawaiian Unemployment Among Seniors over 65 years
COMPARE
Syrian
Hawaiian
Unemployment Among Seniors over 65 years
Unemployment Among Seniors over 65 years Comparison
Syrians
Hawaiians
5.1%
UNEMPLOYMENT AMONG SENIORS OVER 65 YEARS
85.3/ 100
METRIC RATING
133rd/ 347
METRIC RANK
5.4%
UNEMPLOYMENT AMONG SENIORS OVER 65 YEARS
0.1/ 100
METRIC RATING
268th/ 347
METRIC RANK
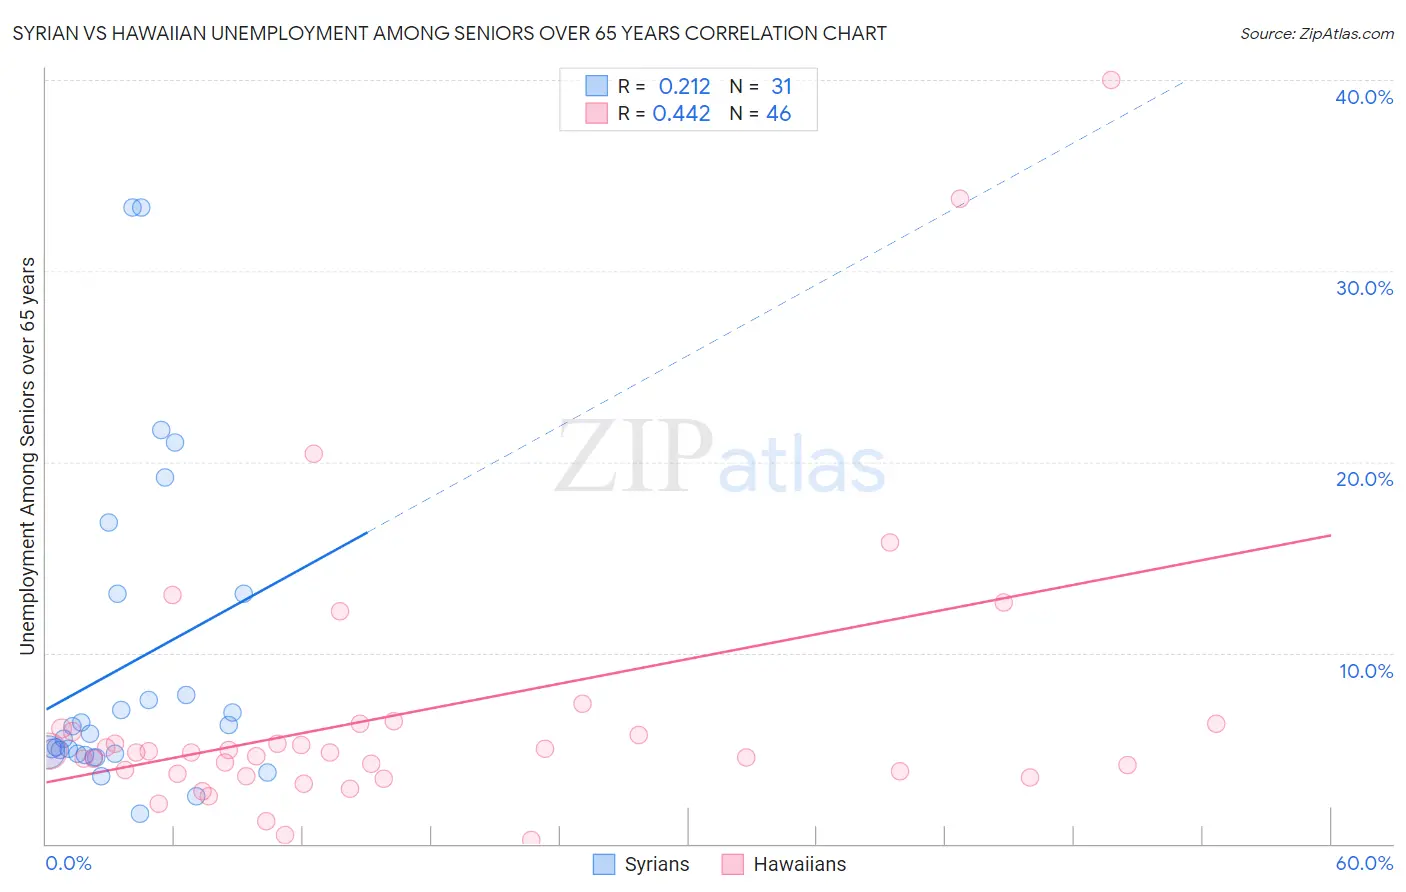
Syrian vs Hawaiian Unemployment Among Seniors over 65 years Correlation Chart
The statistical analysis conducted on geographies consisting of 249,290,936 people shows a weak positive correlation between the proportion of Syrians and unemployment rate amomg seniors over the age of 65 in the United States with a correlation coefficient (R) of 0.212 and weighted average of 5.1%. Similarly, the statistical analysis conducted on geographies consisting of 296,385,493 people shows a moderate positive correlation between the proportion of Hawaiians and unemployment rate amomg seniors over the age of 65 in the United States with a correlation coefficient (R) of 0.442 and weighted average of 5.4%, a difference of 6.7%.
Unemployment Among Seniors over 65 years Correlation Summary
| Measurement | Syrian | Hawaiian |
| Minimum | 1.6% | 0.20% |
| Maximum | 33.3% | 40.0% |
| Range | 31.7% | 39.8% |
| Mean | 9.4% | 6.8% |
| Median | 5.8% | 4.8% |
| Interquartile 25% (IQ1) | 4.7% | 3.7% |
| Interquartile 75% (IQ3) | 13.1% | 6.0% |
| Interquartile Range (IQR) | 8.4% | 2.3% |
| Standard Deviation (Sample) | 8.3% | 7.5% |
| Standard Deviation (Population) | 8.2% | 7.4% |
Similar Demographics by Unemployment Among Seniors over 65 years
Demographics Similar to Syrians by Unemployment Among Seniors over 65 years
In terms of unemployment among seniors over 65 years, the demographic groups most similar to Syrians are Chilean (5.1%, a difference of 0.020%), Immigrants from Australia (5.1%, a difference of 0.030%), Turkish (5.1%, a difference of 0.030%), Ukrainian (5.1%, a difference of 0.050%), and White/Caucasian (5.1%, a difference of 0.060%).
| Demographics | Rating | Rank | Unemployment Among Seniors over 65 years |
| Immigrants | Sri Lanka | 87.4 /100 | #126 | Excellent 5.1% |
| Sri Lankans | 87.4 /100 | #127 | Excellent 5.1% |
| Australians | 87.1 /100 | #128 | Excellent 5.1% |
| Immigrants | England | 86.7 /100 | #129 | Excellent 5.1% |
| Iranians | 86.6 /100 | #130 | Excellent 5.1% |
| Immigrants | Australia | 85.8 /100 | #131 | Excellent 5.1% |
| Chileans | 85.6 /100 | #132 | Excellent 5.1% |
| Syrians | 85.3 /100 | #133 | Excellent 5.1% |
| Turks | 84.9 /100 | #134 | Excellent 5.1% |
| Ukrainians | 84.4 /100 | #135 | Excellent 5.1% |
| Whites/Caucasians | 84.4 /100 | #136 | Excellent 5.1% |
| Arabs | 84.3 /100 | #137 | Excellent 5.1% |
| New Zealanders | 83.2 /100 | #138 | Excellent 5.1% |
| Immigrants | Panama | 83.0 /100 | #139 | Excellent 5.1% |
| Immigrants | Chile | 83.0 /100 | #140 | Excellent 5.1% |
Demographics Similar to Hawaiians by Unemployment Among Seniors over 65 years
In terms of unemployment among seniors over 65 years, the demographic groups most similar to Hawaiians are Chippewa (5.4%, a difference of 0.10%), Pennsylvania German (5.4%, a difference of 0.11%), Immigrants from Colombia (5.4%, a difference of 0.12%), Central American Indian (5.4%, a difference of 0.13%), and Immigrants from Southern Europe (5.4%, a difference of 0.14%).
| Demographics | Rating | Rank | Unemployment Among Seniors over 65 years |
| Spanish American Indians | 0.2 /100 | #261 | Tragic 5.4% |
| Immigrants | Grenada | 0.2 /100 | #262 | Tragic 5.4% |
| South Americans | 0.2 /100 | #263 | Tragic 5.4% |
| Central American Indians | 0.2 /100 | #264 | Tragic 5.4% |
| Immigrants | Colombia | 0.2 /100 | #265 | Tragic 5.4% |
| Pennsylvania Germans | 0.2 /100 | #266 | Tragic 5.4% |
| Chippewa | 0.2 /100 | #267 | Tragic 5.4% |
| Hawaiians | 0.1 /100 | #268 | Tragic 5.4% |
| Immigrants | Southern Europe | 0.1 /100 | #269 | Tragic 5.4% |
| Immigrants | Morocco | 0.1 /100 | #270 | Tragic 5.4% |
| Cypriots | 0.1 /100 | #271 | Tragic 5.4% |
| Immigrants | Jamaica | 0.1 /100 | #272 | Tragic 5.4% |
| Immigrants | Nigeria | 0.1 /100 | #273 | Tragic 5.4% |
| Immigrants | Brazil | 0.1 /100 | #274 | Tragic 5.4% |
| Mexican American Indians | 0.1 /100 | #275 | Tragic 5.4% |