Swiss vs Immigrants from Western Asia Male Unemployment

COMPARE

Swiss
Race
Ancestry
AfghanAfricanAlaska NativeAlaskan AthabascanAlbanianAleutAlsatianAmericanApacheArabArapahoArgentineanArmenianAssyrian/Chaldean/SyriacAustralianAustrianBahamianBangladeshiBarbadianBasqueBelgianBelizeanBermudanBhutaneseBlackfeetBolivianBrazilianBritishBritish West IndianBulgarianBurmeseCajunCambodianCanadianCape VerdeanCarpatho RusynCelticCentral AmericanCentral American IndianCherokeeCheyenneChickasawChileanChineseChippewaChoctawColombianColvilleComancheCosta RicanCreeCreekCroatianCrowCubanCypriotCzechCzechoslovakianDanishDelawareDominicanDutchDutch West IndianEastern EuropeanEcuadorianEgyptianEnglishEstonianEthiopianEuropeanFijianFilipinoFinnishFrenchFrench American IndianFrench CanadianGermanGerman RussianGhanaianGreekGuamanian/ChamorroGuatemalanGuyaneseHaitianHmongHonduranHopiHoumaHungarianIcelanderIndian (Asian)IndonesianInupiatIranianIraqiIrishIroquoisIsraeliItalianJamaicanJapaneseJordanianKenyanKiowaKoreanLaotianLatvianLebaneseLiberianLithuanianLumbeeLuxembourgerMacedonianMalaysianMalteseMarshalleseMenomineeMexicanMexican American IndianMongolianMoroccanNative HawaiianNavajoNepaleseNew ZealanderNicaraguanNigerianNorthern EuropeanNorwegianOkinawanOsageOttawaPaiutePakistaniPalestinianPanamanianParaguayanPennsylvania GermanPeruvianPimaPolishPortuguesePotawatomiPuebloPuerto RicanPuget Sound SalishRomanianRussianSalvadoranSamoanScandinavianScotch-IrishScottishSeminoleSenegaleseSerbianShoshoneSierra LeoneanSiouxSlavicSlovakSloveneSomaliSouth AfricanSouth AmericanSouth American IndianSoviet UnionSpaniardSpanishSpanish AmericanSpanish American IndianSri LankanSubsaharan AfricanSudaneseSwedishSwissSyrianTaiwaneseThaiTlingit-HaidaTohono O'OdhamTonganTrinidadian and TobagonianTsimshianTurkishU.S. Virgin IslanderUgandanUkrainianUruguayanUteVenezuelanVietnameseWelshWest IndianYakamaYaquiYugoslavianYumanYup'ikZimbabwean
Immigration
NonimmigrantsImmigrantsAfghanistanAfricaAlbaniaArgentinaArmeniaAsiaAustraliaAustriaBahamasBangladeshBarbadosBelarusBelgiumBelizeBoliviaBosnia and HerzegovinaBrazilBulgariaBurma/MyanmarCabo VerdeCambodiaCameroonCanadaCaribbeanCentral AmericaChileChinaColombiaCongoCosta RicaCroatiaCubaCzechoslovakiaDenmarkDominicaDominican RepublicEastern AfricaEastern AsiaEastern EuropeEcuadorEgyptEl SalvadorEnglandEritreaEthiopiaEuropeFijiFranceGermanyGhanaGreeceGrenadaGuatemalaGuyanaHaitiHondurasHong KongHungaryIndiaIndonesiaIranIraqIrelandIsraelItalyJamaicaJapanJordanKazakhstanKenyaKoreaKuwaitLaosLatin AmericaLatviaLebanonLiberiaLithuaniaMalaysiaMexicoMicronesiaMiddle AfricaMoldovaMoroccoNepalNetherlandsNicaraguaNigeriaNorth AmericaNorth MacedoniaNorthern AfricaNorthern EuropeNorwayOceaniaPakistanPanamaPeruPhilippinesPolandPortugalRomaniaRussiaSaudi ArabiaScotlandSenegalSerbiaSierra LeoneSingaporeSomaliaSouth AfricaSouth AmericaSouth Central AsiaSouth Eastern AsiaSouthern EuropeSpainSri LankaSt. Vincent and the GrenadinesSudanSwedenSwitzerlandSyriaTaiwanThailandTrinidad and TobagoTurkeyUgandaUkraineUruguayUzbekistanVenezuelaVietnamWest IndiesWestern AfricaWestern EuropeYemenZaireZimbabweAzores
Immigrants from Western Asia
Race
Ancestry
AfghanAfricanAlaska NativeAlaskan AthabascanAlbanianAleutAlsatianAmericanApacheArabArapahoArgentineanArmenianAssyrian/Chaldean/SyriacAustralianAustrianBahamianBangladeshiBarbadianBasqueBelgianBelizeanBermudanBhutaneseBlackfeetBolivianBrazilianBritishBritish West IndianBulgarianBurmeseCajunCambodianCanadianCape VerdeanCarpatho RusynCelticCentral AmericanCentral American IndianCherokeeCheyenneChickasawChileanChineseChippewaChoctawColombianColvilleComancheCosta RicanCreeCreekCroatianCrowCubanCypriotCzechCzechoslovakianDanishDelawareDominicanDutchDutch West IndianEastern EuropeanEcuadorianEgyptianEnglishEstonianEthiopianEuropeanFijianFilipinoFinnishFrenchFrench American IndianFrench CanadianGermanGerman RussianGhanaianGreekGuamanian/ChamorroGuatemalanGuyaneseHaitianHmongHonduranHopiHoumaHungarianIcelanderIndian (Asian)IndonesianInupiatIranianIraqiIrishIroquoisIsraeliItalianJamaicanJapaneseJordanianKenyanKiowaKoreanLaotianLatvianLebaneseLiberianLithuanianLumbeeLuxembourgerMacedonianMalaysianMalteseMarshalleseMenomineeMexicanMexican American IndianMongolianMoroccanNative HawaiianNavajoNepaleseNew ZealanderNicaraguanNigerianNorthern EuropeanNorwegianOkinawanOsageOttawaPaiutePakistaniPalestinianPanamanianParaguayanPennsylvania GermanPeruvianPimaPolishPortuguesePotawatomiPuebloPuerto RicanPuget Sound SalishRomanianRussianSalvadoranSamoanScandinavianScotch-IrishScottishSeminoleSenegaleseSerbianShoshoneSierra LeoneanSiouxSlavicSlovakSloveneSomaliSouth AfricanSouth AmericanSouth American IndianSoviet UnionSpaniardSpanishSpanish AmericanSpanish American IndianSri LankanSubsaharan AfricanSudaneseSwedishSyrianTaiwaneseThaiTlingit-HaidaTohono O'OdhamTonganTrinidadian and TobagonianTsimshianTurkishU.S. Virgin IslanderUgandanUkrainianUruguayanUteVenezuelanVietnameseWelshWest IndianYakamaYaquiYugoslavianYumanYup'ikZimbabwean
Immigration
NonimmigrantsImmigrantsAfghanistanAfricaAlbaniaArgentinaArmeniaAsiaAustraliaAustriaBahamasBangladeshBarbadosBelarusBelgiumBelizeBoliviaBosnia and HerzegovinaBrazilBulgariaBurma/MyanmarCabo VerdeCambodiaCameroonCanadaCaribbeanCentral AmericaChileChinaColombiaCongoCosta RicaCroatiaCubaCzechoslovakiaDenmarkDominicaDominican RepublicEastern AfricaEastern AsiaEastern EuropeEcuadorEgyptEl SalvadorEnglandEritreaEthiopiaEuropeFijiFranceGermanyGhanaGreeceGrenadaGuatemalaGuyanaHaitiHondurasHong KongHungaryIndiaIndonesiaIranIraqIrelandIsraelItalyJamaicaJapanJordanKazakhstanKenyaKoreaKuwaitLaosLatin AmericaLatviaLebanonLiberiaLithuaniaMalaysiaMexicoMicronesiaMiddle AfricaMoldovaMoroccoNepalNetherlandsNicaraguaNigeriaNorth AmericaNorth MacedoniaNorthern AfricaNorthern EuropeNorwayOceaniaPakistanPanamaPeruPhilippinesPolandPortugalRomaniaRussiaSaudi ArabiaScotlandSenegalSerbiaSierra LeoneSingaporeSomaliaSouth AfricaSouth AmericaSouth Central AsiaSouth Eastern AsiaSouthern EuropeSpainSri LankaSt. Vincent and the GrenadinesSudanSwedenSwitzerlandSyriaTaiwanThailandTrinidad and TobagoTurkeyUgandaUkraineUruguayUzbekistanVenezuelaVietnamWest IndiesWestern AfricaWestern AsiaWestern EuropeYemenZaireZimbabweAzores
Male Unemployment
Income
Poverty
Unemployment
Labor Participation
Family Structure
Vehicle Availability
Education Level
Disability

Male Unemployment Comparison

Swiss

Immigrants from Western Asia

Exceptional
Tragic
4.7%
MALE UNEMPLOYMENT
99.9/ 100
METRIC RATING
16th/ 347
METRIC RANK
5.6%
MALE UNEMPLOYMENT
3.5/ 100
METRIC RATING
219th/ 347
METRIC RANK

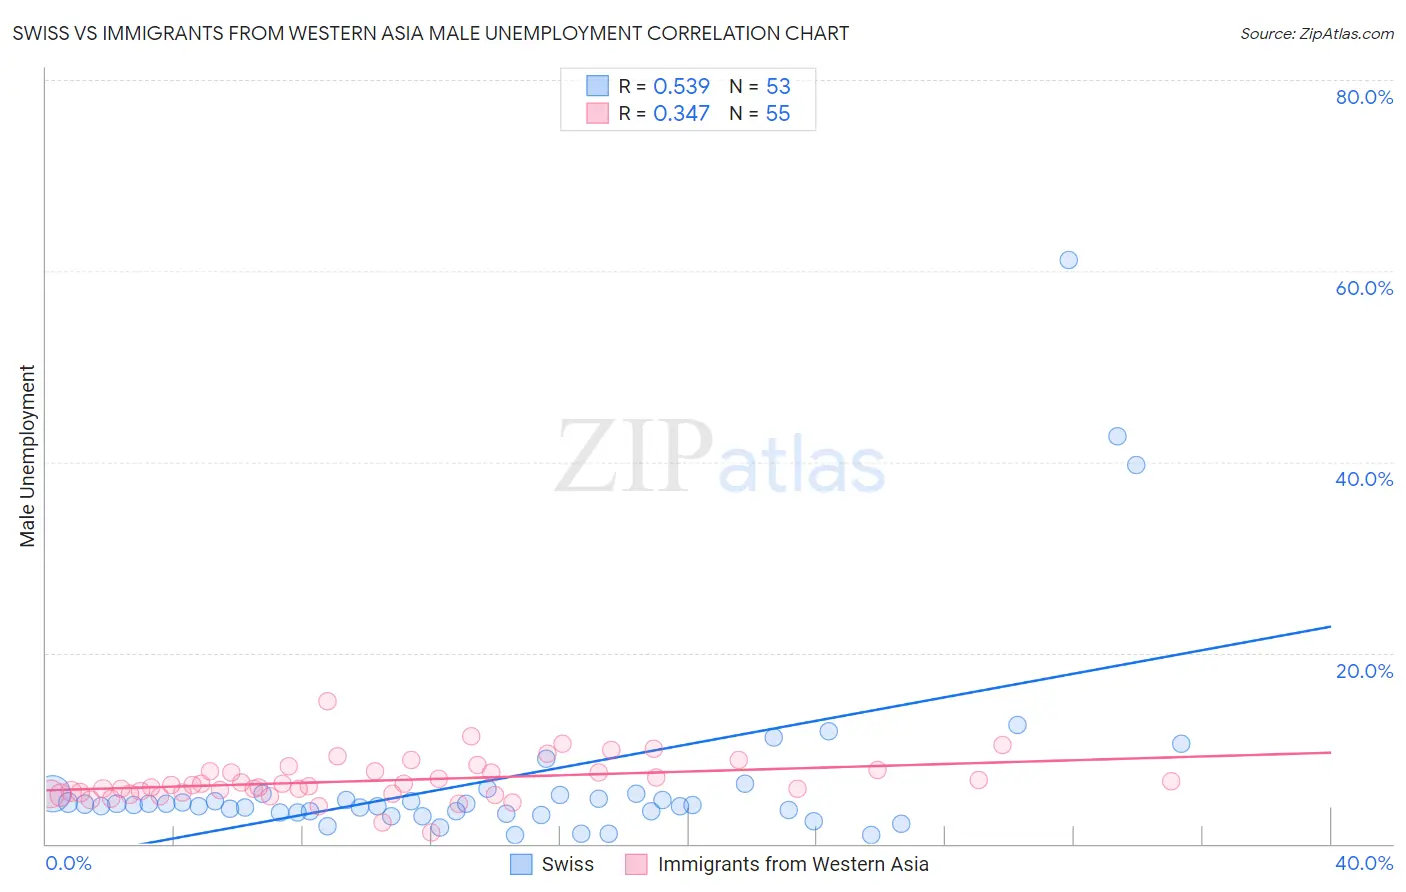
Swiss vs Immigrants from Western Asia Male Unemployment Correlation Chart

The statistical analysis conducted on geographies consisting of 460,477,657 people shows a substantial positive correlation between the proportion of Swiss and unemployment rate among males in the United States with a correlation coefficient (R) of 0.539 and weighted average of 4.7%. Similarly, the statistical analysis conducted on geographies consisting of 403,036,222 people shows a mild positive correlation between the proportion of Immigrants from Western Asia and unemployment rate among males in the United States with a correlation coefficient (R) of 0.347 and weighted average of 5.6%, a difference of 17.9%.
Swiss vs Immigrants from Western Asia Male Unemployment

Male Unemployment Correlation Summary

MeasurementSwissImmigrants from Western Asia
Minimum0.90%1.2%
Maximum61.1%14.9%
Range60.2%13.7%
Mean6.9%6.6%
Median4.1%6.1%
Interquartile 25% (IQ1)3.3%5.2%
Interquartile 75% (IQ3)5.2%7.6%
Interquartile Range (IQR)1.8%2.4%
Standard Deviation (Sample)10.7%2.3%
Standard Deviation (Population)10.6%2.3%

Similar Demographics by Male Unemployment

Demographics Similar to Swiss by Male Unemployment

In terms of male unemployment, the demographic groups most similar to Swiss are Scandinavian (4.7%, a difference of 0.050%), German (4.7%, a difference of 0.32%), Bolivian (4.7%, a difference of 0.34%), Filipino (4.7%, a difference of 0.73%), and Immigrants from Bolivia (4.7%, a difference of 1.0%).
DemographicsRating | RankMale Unemployment
Thais
100.0
/100
|
#9
Exceptional
4.6%
Cubans
100.0
/100
|
#10
Exceptional
4.6%
Swedes
100.0
/100
|
#11
Exceptional
4.6%
Immigrants | Bolivia
100.0
/100
|
#12
Exceptional
4.7%
Bolivians
100.0
/100
|
#13
Exceptional
4.7%
Germans
100.0
/100
|
#14
Exceptional
4.7%
Scandinavians
100.0
/100
|
#15
Exceptional
4.7%
Swiss
99.9
/100
|
#16
Exceptional
4.7%
Filipinos
99.9
/100
|
#17
Exceptional
4.7%
English
99.9
/100
|
#18
Exceptional
4.8%
Europeans
99.9
/100
|
#19
Exceptional
4.8%
Pennsylvania Germans
99.9
/100
|
#20
Exceptional
4.8%
Immigrants | Taiwan
99.9
/100
|
#21
Exceptional
4.8%
Carpatho Rusyns
99.9
/100
|
#22
Exceptional
4.8%
Tongans
99.9
/100
|
#23
Exceptional
4.8%

Demographics Similar to Immigrants from Western Asia by Male Unemployment

In terms of male unemployment, the demographic groups most similar to Immigrants from Western Asia are Portuguese (5.6%, a difference of 0.030%), Immigrants from Albania (5.5%, a difference of 0.050%), Soviet Union (5.6%, a difference of 0.13%), Delaware (5.5%, a difference of 0.25%), and Immigrants from Micronesia (5.6%, a difference of 0.27%).
DemographicsRating | RankMale Unemployment
Hmong
7.0
/100
|
#212
Tragic
5.5%
Ugandans
6.3
/100
|
#213
Tragic
5.5%
Puget Sound Salish
5.6
/100
|
#214
Tragic
5.5%
Samoans
4.9
/100
|
#215
Tragic
5.5%
Immigrants | Immigrants
4.3
/100
|
#216
Tragic
5.5%
Delaware
4.2
/100
|
#217
Tragic
5.5%
Immigrants | Albania
3.6
/100
|
#218
Tragic
5.5%
Immigrants | Western Asia
3.5
/100
|
#219
Tragic
5.6%
Portuguese
3.5
/100
|
#220
Tragic
5.6%
Soviet Union
3.2
/100
|
#221
Tragic
5.6%
Immigrants | Micronesia
2.9
/100
|
#222
Tragic
5.6%
Creek
2.6
/100
|
#223
Tragic
5.6%
Cherokee
2.4
/100
|
#224
Tragic
5.6%
Panamanians
1.9
/100
|
#225
Tragic
5.6%
Immigrants | Cambodia
1.8
/100
|
#226
Tragic
5.6%