Swiss vs Immigrants from Taiwan Female Unemployment

COMPARE

Swiss
Race
Ancestry
AfghanAfricanAlaska NativeAlaskan AthabascanAlbanianAleutAlsatianAmericanApacheArabArapahoArgentineanArmenianAssyrian/Chaldean/SyriacAustralianAustrianBahamianBangladeshiBarbadianBasqueBelgianBelizeanBermudanBhutaneseBlackfeetBolivianBrazilianBritishBritish West IndianBulgarianBurmeseCajunCambodianCanadianCape VerdeanCarpatho RusynCelticCentral AmericanCentral American IndianCherokeeCheyenneChickasawChileanChineseChippewaChoctawColombianColvilleComancheCosta RicanCreeCreekCroatianCrowCubanCypriotCzechCzechoslovakianDanishDelawareDominicanDutchDutch West IndianEastern EuropeanEcuadorianEgyptianEnglishEstonianEthiopianEuropeanFijianFilipinoFinnishFrenchFrench American IndianFrench CanadianGermanGerman RussianGhanaianGreekGuamanian/ChamorroGuatemalanGuyaneseHaitianHmongHonduranHopiHoumaHungarianIcelanderIndian (Asian)IndonesianInupiatIranianIraqiIrishIroquoisIsraeliItalianJamaicanJapaneseJordanianKenyanKiowaKoreanLaotianLatvianLebaneseLiberianLithuanianLumbeeLuxembourgerMacedonianMalaysianMalteseMarshalleseMenomineeMexicanMexican American IndianMongolianMoroccanNative HawaiianNavajoNepaleseNew ZealanderNicaraguanNigerianNorthern EuropeanNorwegianOkinawanOsageOttawaPaiutePakistaniPalestinianPanamanianParaguayanPennsylvania GermanPeruvianPimaPolishPortuguesePotawatomiPuebloPuerto RicanPuget Sound SalishRomanianRussianSalvadoranSamoanScandinavianScotch-IrishScottishSeminoleSenegaleseSerbianShoshoneSierra LeoneanSiouxSlavicSlovakSloveneSomaliSouth AfricanSouth AmericanSouth American IndianSoviet UnionSpaniardSpanishSpanish AmericanSpanish American IndianSri LankanSubsaharan AfricanSudaneseSwedishSwissSyrianTaiwaneseThaiTlingit-HaidaTohono O'OdhamTonganTrinidadian and TobagonianTsimshianTurkishU.S. Virgin IslanderUgandanUkrainianUruguayanUteVenezuelanVietnameseWelshWest IndianYakamaYaquiYugoslavianYumanYup'ikZimbabwean
Immigration
NonimmigrantsImmigrantsAfghanistanAfricaAlbaniaArgentinaArmeniaAsiaAustraliaAustriaBahamasBangladeshBarbadosBelarusBelgiumBelizeBoliviaBosnia and HerzegovinaBrazilBulgariaBurma/MyanmarCabo VerdeCambodiaCameroonCanadaCaribbeanCentral AmericaChileChinaColombiaCongoCosta RicaCroatiaCubaCzechoslovakiaDenmarkDominicaDominican RepublicEastern AfricaEastern AsiaEastern EuropeEcuadorEgyptEl SalvadorEnglandEritreaEthiopiaEuropeFijiFranceGermanyGhanaGreeceGrenadaGuatemalaGuyanaHaitiHondurasHong KongHungaryIndiaIndonesiaIranIraqIrelandIsraelItalyJamaicaJapanJordanKazakhstanKenyaKoreaKuwaitLaosLatin AmericaLatviaLebanonLiberiaLithuaniaMalaysiaMexicoMicronesiaMiddle AfricaMoldovaMoroccoNepalNetherlandsNicaraguaNigeriaNorth AmericaNorth MacedoniaNorthern AfricaNorthern EuropeNorwayOceaniaPakistanPanamaPeruPhilippinesPolandPortugalRomaniaRussiaSaudi ArabiaScotlandSenegalSerbiaSierra LeoneSingaporeSomaliaSouth AfricaSouth AmericaSouth Central AsiaSouth Eastern AsiaSouthern EuropeSpainSri LankaSt. Vincent and the GrenadinesSudanSwedenSwitzerlandSyriaThailandTrinidad and TobagoTurkeyUgandaUkraineUruguayUzbekistanVenezuelaVietnamWest IndiesWestern AfricaWestern AsiaWestern EuropeYemenZaireZimbabweAzores
Immigrants from Taiwan
Race
Ancestry
AfghanAfricanAlaska NativeAlaskan AthabascanAlbanianAleutAlsatianAmericanApacheArabArapahoArgentineanArmenianAssyrian/Chaldean/SyriacAustralianAustrianBahamianBangladeshiBarbadianBasqueBelgianBelizeanBermudanBhutaneseBlackfeetBolivianBrazilianBritishBritish West IndianBulgarianBurmeseCajunCambodianCanadianCape VerdeanCarpatho RusynCelticCentral AmericanCentral American IndianCherokeeCheyenneChickasawChileanChineseChippewaChoctawColombianColvilleComancheCosta RicanCreeCreekCroatianCrowCubanCypriotCzechCzechoslovakianDanishDelawareDominicanDutchDutch West IndianEastern EuropeanEcuadorianEgyptianEnglishEstonianEthiopianEuropeanFijianFilipinoFinnishFrenchFrench American IndianFrench CanadianGermanGerman RussianGhanaianGreekGuamanian/ChamorroGuatemalanGuyaneseHaitianHmongHonduranHopiHoumaHungarianIcelanderIndian (Asian)IndonesianInupiatIranianIraqiIrishIroquoisIsraeliItalianJamaicanJapaneseJordanianKenyanKiowaKoreanLaotianLatvianLebaneseLiberianLithuanianLumbeeLuxembourgerMacedonianMalaysianMalteseMarshalleseMenomineeMexicanMexican American IndianMongolianMoroccanNative HawaiianNavajoNepaleseNew ZealanderNicaraguanNigerianNorthern EuropeanNorwegianOkinawanOsageOttawaPaiutePakistaniPalestinianPanamanianParaguayanPennsylvania GermanPeruvianPimaPolishPortuguesePotawatomiPuebloPuerto RicanPuget Sound SalishRomanianRussianSalvadoranSamoanScandinavianScotch-IrishScottishSeminoleSenegaleseSerbianShoshoneSierra LeoneanSiouxSlavicSlovakSloveneSomaliSouth AfricanSouth AmericanSouth American IndianSoviet UnionSpaniardSpanishSpanish AmericanSpanish American IndianSri LankanSubsaharan AfricanSudaneseSwedishSyrianTaiwaneseThaiTlingit-HaidaTohono O'OdhamTonganTrinidadian and TobagonianTsimshianTurkishU.S. Virgin IslanderUgandanUkrainianUruguayanUteVenezuelanVietnameseWelshWest IndianYakamaYaquiYugoslavianYumanYup'ikZimbabwean
Immigration
NonimmigrantsImmigrantsAfghanistanAfricaAlbaniaArgentinaArmeniaAsiaAustraliaAustriaBahamasBangladeshBarbadosBelarusBelgiumBelizeBoliviaBosnia and HerzegovinaBrazilBulgariaBurma/MyanmarCabo VerdeCambodiaCameroonCanadaCaribbeanCentral AmericaChileChinaColombiaCongoCosta RicaCroatiaCubaCzechoslovakiaDenmarkDominicaDominican RepublicEastern AfricaEastern AsiaEastern EuropeEcuadorEgyptEl SalvadorEnglandEritreaEthiopiaEuropeFijiFranceGermanyGhanaGreeceGrenadaGuatemalaGuyanaHaitiHondurasHong KongHungaryIndiaIndonesiaIranIraqIrelandIsraelItalyJamaicaJapanJordanKazakhstanKenyaKoreaKuwaitLaosLatin AmericaLatviaLebanonLiberiaLithuaniaMalaysiaMexicoMicronesiaMiddle AfricaMoldovaMoroccoNepalNetherlandsNicaraguaNigeriaNorth AmericaNorth MacedoniaNorthern AfricaNorthern EuropeNorwayOceaniaPakistanPanamaPeruPhilippinesPolandPortugalRomaniaRussiaSaudi ArabiaScotlandSenegalSerbiaSierra LeoneSingaporeSomaliaSouth AfricaSouth AmericaSouth Central AsiaSouth Eastern AsiaSouthern EuropeSpainSri LankaSt. Vincent and the GrenadinesSudanSwedenSwitzerlandSyriaTaiwanThailandTrinidad and TobagoTurkeyUgandaUkraineUruguayUzbekistanVenezuelaVietnamWest IndiesWestern AfricaWestern AsiaWestern EuropeYemenZaireZimbabweAzores
Female Unemployment
Income
Poverty
Unemployment
Labor Participation
Family Structure
Vehicle Availability
Education Level
Disability

Female Unemployment Comparison

Swiss

Immigrants from Taiwan

Exceptional
Exceptional
4.6%
FEMALE UNEMPLOYMENT
100.0/ 100
METRIC RATING
10th/ 347
METRIC RANK
5.0%
FEMALE UNEMPLOYMENT
96.6/ 100
METRIC RATING
89th/ 347
METRIC RANK

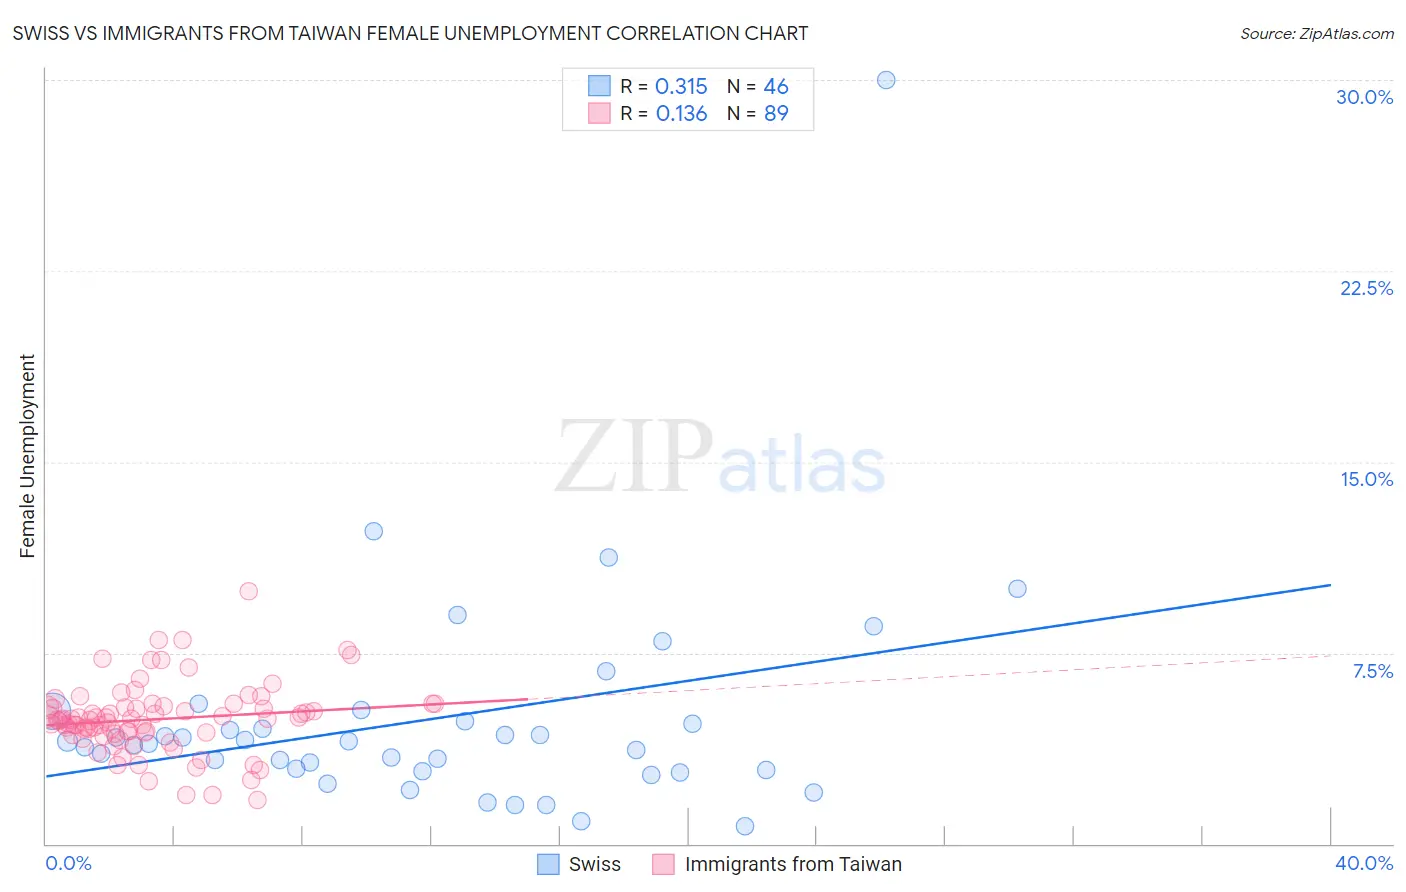
Swiss vs Immigrants from Taiwan Female Unemployment Correlation Chart

The statistical analysis conducted on geographies consisting of 458,890,724 people shows a mild positive correlation between the proportion of Swiss and unemploymnet rate among females in the United States with a correlation coefficient (R) of 0.315 and weighted average of 4.6%. Similarly, the statistical analysis conducted on geographies consisting of 297,604,617 people shows a poor positive correlation between the proportion of Immigrants from Taiwan and unemploymnet rate among females in the United States with a correlation coefficient (R) of 0.136 and weighted average of 5.0%, a difference of 9.5%.
Swiss vs Immigrants from Taiwan Female Unemployment

Female Unemployment Correlation Summary

MeasurementSwissImmigrants from Taiwan
Minimum0.70%1.7%
Maximum30.0%9.9%
Range29.3%8.2%
Mean4.9%4.9%
Median4.0%4.9%
Interquartile 25% (IQ1)2.9%4.3%
Interquartile 75% (IQ3)4.8%5.4%
Interquartile Range (IQR)1.9%1.1%
Standard Deviation (Sample)4.5%1.4%
Standard Deviation (Population)4.5%1.4%

Similar Demographics by Female Unemployment

Demographics Similar to Swiss by Female Unemployment

In terms of female unemployment, the demographic groups most similar to Swiss are Scandinavian (4.6%, a difference of 0.11%), Dutch (4.6%, a difference of 0.71%), Belgian (4.6%, a difference of 0.86%), Slovene (4.5%, a difference of 1.3%), and Finnish (4.6%, a difference of 1.5%).
DemographicsRating | RankFemale Unemployment
Luxembourgers
100.0
/100
|
#3
Exceptional
4.4%
Danes
100.0
/100
|
#4
Exceptional
4.4%
Hmong
100.0
/100
|
#5
Exceptional
4.4%
Swedes
100.0
/100
|
#6
Exceptional
4.4%
Chinese
100.0
/100
|
#7
Exceptional
4.5%
Germans
100.0
/100
|
#8
Exceptional
4.5%
Slovenes
100.0
/100
|
#9
Exceptional
4.5%
Swiss
100.0
/100
|
#10
Exceptional
4.6%
Scandinavians
100.0
/100
|
#11
Exceptional
4.6%
Dutch
100.0
/100
|
#12
Exceptional
4.6%
Belgians
100.0
/100
|
#13
Exceptional
4.6%
Finns
100.0
/100
|
#14
Exceptional
4.6%
English
100.0
/100
|
#15
Exceptional
4.6%
Carpatho Rusyns
99.9
/100
|
#16
Exceptional
4.7%
Croatians
99.9
/100
|
#17
Exceptional
4.7%

Demographics Similar to Immigrants from Taiwan by Female Unemployment

In terms of female unemployment, the demographic groups most similar to Immigrants from Taiwan are Immigrants from Sudan (5.0%, a difference of 0.060%), Venezuelan (5.0%, a difference of 0.15%), Immigrants from Sweden (5.0%, a difference of 0.17%), Bolivian (5.0%, a difference of 0.23%), and Ukrainian (5.0%, a difference of 0.24%).
DemographicsRating | RankFemale Unemployment
Immigrants | Australia
97.3
/100
|
#82
Exceptional
5.0%
Immigrants | Serbia
97.2
/100
|
#83
Exceptional
5.0%
Canadians
97.2
/100
|
#84
Exceptional
5.0%
Ukrainians
97.1
/100
|
#85
Exceptional
5.0%
Bolivians
97.1
/100
|
#86
Exceptional
5.0%
Venezuelans
96.9
/100
|
#87
Exceptional
5.0%
Immigrants | Sudan
96.7
/100
|
#88
Exceptional
5.0%
Immigrants | Taiwan
96.6
/100
|
#89
Exceptional
5.0%
Immigrants | Sweden
96.3
/100
|
#90
Exceptional
5.0%
Immigrants | Japan
96.0
/100
|
#91
Exceptional
5.0%
Romanians
95.9
/100
|
#92
Exceptional
5.0%
Immigrants | Austria
95.7
/100
|
#93
Exceptional
5.0%
Immigrants | Malaysia
95.7
/100
|
#94
Exceptional
5.0%
Burmese
95.6
/100
|
#95
Exceptional
5.0%
Immigrants | South Central Asia
95.5
/100
|
#96
Exceptional
5.0%