Swedish vs Palestinian Unemployment Among Seniors over 65 years
COMPARE
Swedish
Palestinian
Unemployment Among Seniors over 65 years
Unemployment Among Seniors over 65 years Comparison
Swedes
Palestinians
4.9%
UNEMPLOYMENT AMONG SENIORS OVER 65 YEARS
99.9/ 100
METRIC RATING
52nd/ 347
METRIC RANK
4.8%
UNEMPLOYMENT AMONG SENIORS OVER 65 YEARS
100.0/ 100
METRIC RATING
33rd/ 347
METRIC RANK
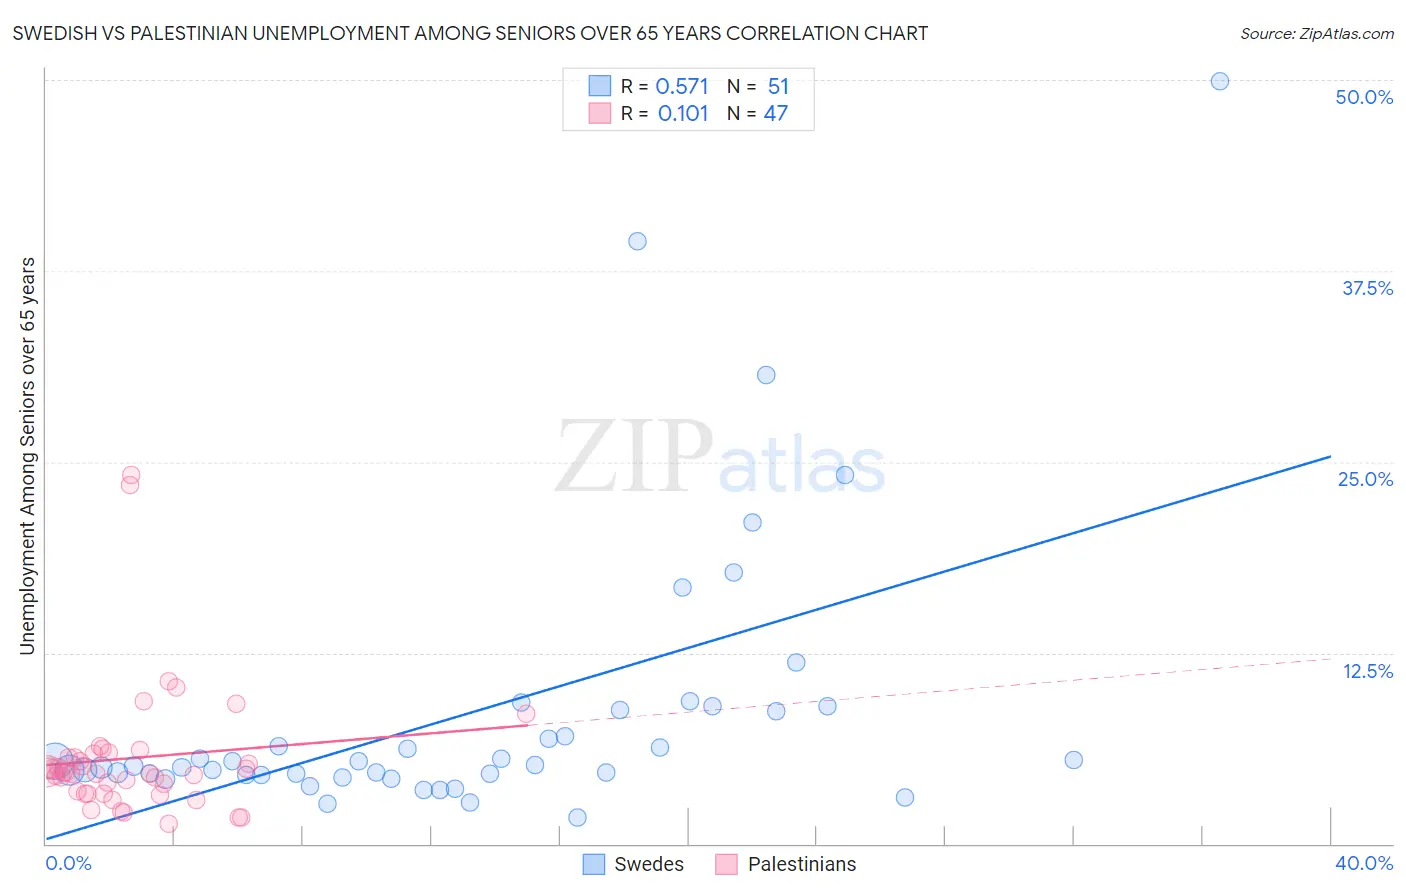
Swedish vs Palestinian Unemployment Among Seniors over 65 years Correlation Chart
The statistical analysis conducted on geographies consisting of 445,176,213 people shows a substantial positive correlation between the proportion of Swedes and unemployment rate amomg seniors over the age of 65 in the United States with a correlation coefficient (R) of 0.571 and weighted average of 4.9%. Similarly, the statistical analysis conducted on geographies consisting of 205,968,161 people shows a poor positive correlation between the proportion of Palestinians and unemployment rate amomg seniors over the age of 65 in the United States with a correlation coefficient (R) of 0.101 and weighted average of 4.8%, a difference of 1.4%.
Unemployment Among Seniors over 65 years Correlation Summary
| Measurement | Swedish | Palestinian |
| Minimum | 1.8% | 1.3% |
| Maximum | 49.9% | 24.1% |
| Range | 48.1% | 22.8% |
| Mean | 8.6% | 5.6% |
| Median | 5.1% | 4.6% |
| Interquartile 25% (IQ1) | 4.5% | 3.3% |
| Interquartile 75% (IQ3) | 8.8% | 5.9% |
| Interquartile Range (IQR) | 4.3% | 2.7% |
| Standard Deviation (Sample) | 9.3% | 4.4% |
| Standard Deviation (Population) | 9.2% | 4.4% |
Demographics Similar to Swedes and Palestinians by Unemployment Among Seniors over 65 years
In terms of unemployment among seniors over 65 years, the demographic groups most similar to Swedes are Scotch-Irish (4.9%, a difference of 0.020%), Immigrants from Austria (4.9%, a difference of 0.14%), Immigrants from Kenya (4.9%, a difference of 0.15%), Choctaw (4.9%, a difference of 0.33%), and German (4.9%, a difference of 0.35%). Similarly, the demographic groups most similar to Palestinians are Slovene (4.8%, a difference of 0.090%), Bhutanese (4.8%, a difference of 0.34%), Immigrants from Kuwait (4.8%, a difference of 0.36%), Cambodian (4.8%, a difference of 0.49%), and Bulgarian (4.8%, a difference of 0.51%).
| Demographics | Rating | Rank | Unemployment Among Seniors over 65 years |
| Slovenes | 100.0 /100 | #32 | Exceptional 4.8% |
| Palestinians | 100.0 /100 | #33 | Exceptional 4.8% |
| Bhutanese | 100.0 /100 | #34 | Exceptional 4.8% |
| Immigrants | Kuwait | 100.0 /100 | #35 | Exceptional 4.8% |
| Cambodians | 100.0 /100 | #36 | Exceptional 4.8% |
| Bulgarians | 99.9 /100 | #37 | Exceptional 4.8% |
| Immigrants | India | 99.9 /100 | #38 | Exceptional 4.8% |
| Macedonians | 99.9 /100 | #39 | Exceptional 4.8% |
| Immigrants | Sweden | 99.9 /100 | #40 | Exceptional 4.8% |
| Kiowa | 99.9 /100 | #41 | Exceptional 4.8% |
| Swiss | 99.9 /100 | #42 | Exceptional 4.8% |
| Luxembourgers | 99.9 /100 | #43 | Exceptional 4.8% |
| Jordanians | 99.9 /100 | #44 | Exceptional 4.9% |
| Ethiopians | 99.9 /100 | #45 | Exceptional 4.9% |
| Immigrants | Jordan | 99.9 /100 | #46 | Exceptional 4.9% |
| Germans | 99.9 /100 | #47 | Exceptional 4.9% |
| Choctaw | 99.9 /100 | #48 | Exceptional 4.9% |
| Immigrants | Kenya | 99.9 /100 | #49 | Exceptional 4.9% |
| Immigrants | Austria | 99.9 /100 | #50 | Exceptional 4.9% |
| Scotch-Irish | 99.9 /100 | #51 | Exceptional 4.9% |
| Swedes | 99.9 /100 | #52 | Exceptional 4.9% |