Sri Lankan vs Spanish American Unemployment
COMPARE
Sri Lankan
Spanish American
Unemployment
Unemployment Comparison
Sri Lankans
Spanish Americans
5.2%
UNEMPLOYMENT
69.5/ 100
METRIC RATING
157th/ 347
METRIC RANK
5.6%
UNEMPLOYMENT
2.0/ 100
METRIC RATING
242nd/ 347
METRIC RANK
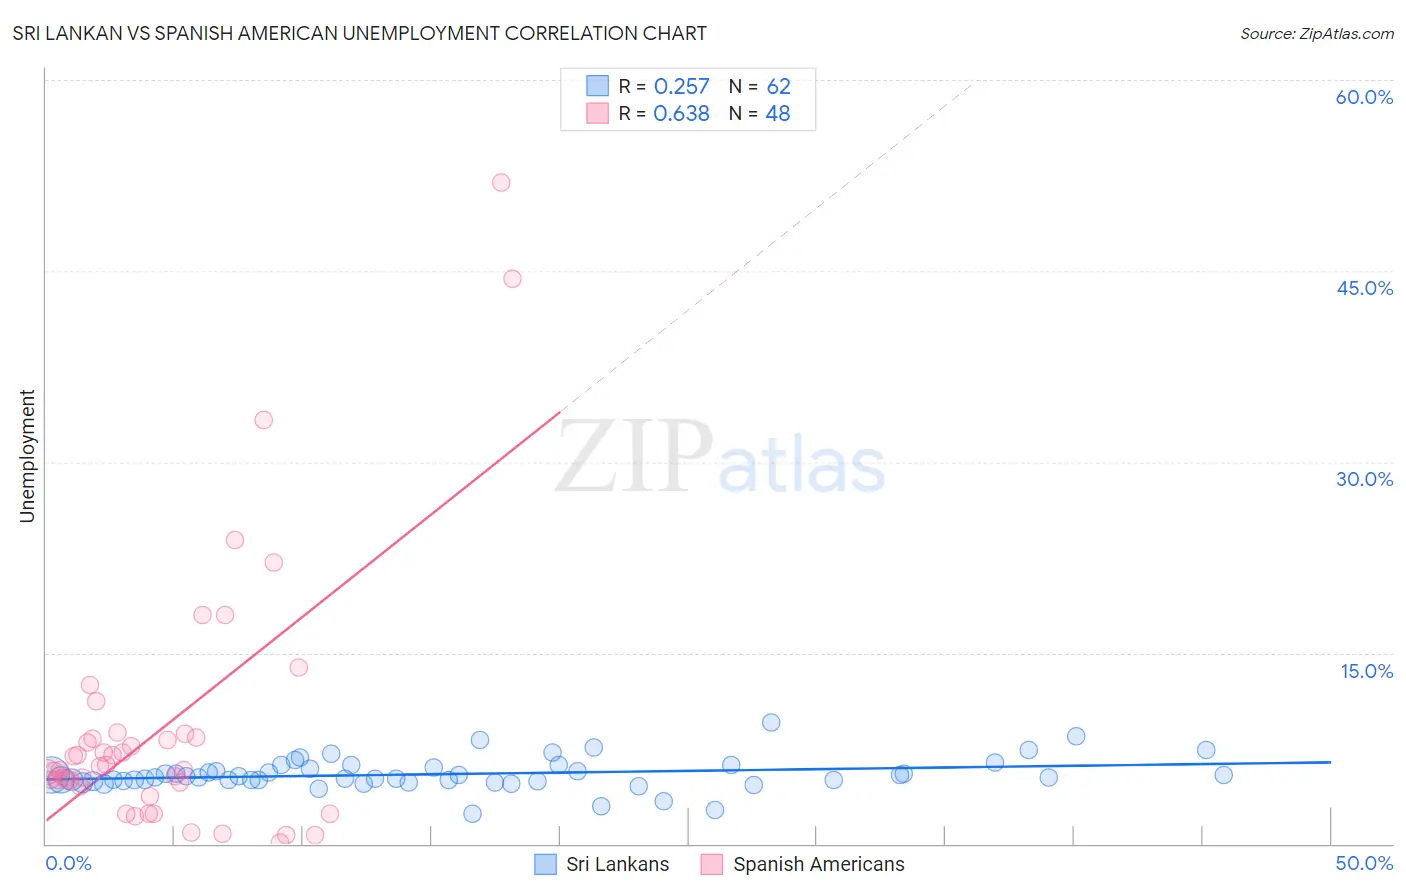
Sri Lankan vs Spanish American Unemployment Correlation Chart
The statistical analysis conducted on geographies consisting of 440,052,205 people shows a weak positive correlation between the proportion of Sri Lankans and unemployment in the United States with a correlation coefficient (R) of 0.257 and weighted average of 5.2%. Similarly, the statistical analysis conducted on geographies consisting of 103,137,220 people shows a significant positive correlation between the proportion of Spanish Americans and unemployment in the United States with a correlation coefficient (R) of 0.638 and weighted average of 5.6%, a difference of 7.3%.
Unemployment Correlation Summary
| Measurement | Sri Lankan | Spanish American |
| Minimum | 2.4% | 0.10% |
| Maximum | 9.5% | 51.9% |
| Range | 7.1% | 51.8% |
| Mean | 5.5% | 9.2% |
| Median | 5.2% | 5.9% |
| Interquartile 25% (IQ1) | 5.0% | 4.7% |
| Interquartile 75% (IQ3) | 6.0% | 8.5% |
| Interquartile Range (IQR) | 1.0% | 3.8% |
| Standard Deviation (Sample) | 1.2% | 10.4% |
| Standard Deviation (Population) | 1.2% | 10.3% |
Similar Demographics by Unemployment
Demographics Similar to Sri Lankans by Unemployment
In terms of unemployment, the demographic groups most similar to Sri Lankans are Immigrants from Kazakhstan (5.2%, a difference of 0.060%), Immigrants from Northern Africa (5.2%, a difference of 0.13%), Immigrants from Egypt (5.2%, a difference of 0.20%), Immigrants from Russia (5.2%, a difference of 0.20%), and Laotian (5.2%, a difference of 0.23%).
| Demographics | Rating | Rank | Unemployment |
| Potawatomi | 76.2 /100 | #150 | Good 5.2% |
| Immigrants | Eastern Europe | 75.3 /100 | #151 | Good 5.2% |
| Immigrants | Hong Kong | 75.2 /100 | #152 | Good 5.2% |
| Egyptians | 75.2 /100 | #153 | Good 5.2% |
| Immigrants | China | 74.7 /100 | #154 | Good 5.2% |
| Immigrants | Northern Africa | 71.3 /100 | #155 | Good 5.2% |
| Immigrants | Kazakhstan | 70.4 /100 | #156 | Good 5.2% |
| Sri Lankans | 69.5 /100 | #157 | Good 5.2% |
| Immigrants | Egypt | 66.7 /100 | #158 | Good 5.2% |
| Immigrants | Russia | 66.6 /100 | #159 | Good 5.2% |
| Laotians | 66.3 /100 | #160 | Good 5.2% |
| Immigrants | Oceania | 65.2 /100 | #161 | Good 5.2% |
| Spanish | 65.1 /100 | #162 | Good 5.2% |
| Immigrants | Zaire | 64.7 /100 | #163 | Good 5.2% |
| Immigrants | Colombia | 64.7 /100 | #164 | Good 5.2% |
Demographics Similar to Spanish Americans by Unemployment
In terms of unemployment, the demographic groups most similar to Spanish Americans are Tlingit-Haida (5.6%, a difference of 0.0%), Cree (5.6%, a difference of 0.35%), Immigrants (5.5%, a difference of 0.36%), Immigrants from Western Asia (5.5%, a difference of 0.45%), and Marshallese (5.6%, a difference of 0.64%).
| Demographics | Rating | Rank | Unemployment |
| Immigrants | Panama | 3.4 /100 | #235 | Tragic 5.5% |
| Immigrants | Cambodia | 3.3 /100 | #236 | Tragic 5.5% |
| Moroccans | 3.2 /100 | #237 | Tragic 5.5% |
| Immigrants | Western Asia | 2.8 /100 | #238 | Tragic 5.5% |
| Immigrants | Immigrants | 2.6 /100 | #239 | Tragic 5.5% |
| Cree | 2.6 /100 | #240 | Tragic 5.6% |
| Tlingit-Haida | 2.0 /100 | #241 | Tragic 5.6% |
| Spanish Americans | 2.0 /100 | #242 | Tragic 5.6% |
| Marshallese | 1.3 /100 | #243 | Tragic 5.6% |
| Dutch West Indians | 1.2 /100 | #244 | Tragic 5.6% |
| French American Indians | 1.2 /100 | #245 | Tragic 5.6% |
| Bermudans | 1.1 /100 | #246 | Tragic 5.6% |
| Immigrants | Cameroon | 1.0 /100 | #247 | Tragic 5.6% |
| Liberians | 0.9 /100 | #248 | Tragic 5.6% |
| Cajuns | 0.8 /100 | #249 | Tragic 5.6% |