Sri Lankan vs Salvadoran Unemployment Among Ages 16 to 19 years

COMPARE

Sri Lankan
Race
Ancestry
AfghanAfricanAlaska NativeAlaskan AthabascanAlbanianAleutAlsatianAmericanApacheArabArapahoArgentineanArmenianAssyrian/Chaldean/SyriacAustralianAustrianBahamianBangladeshiBarbadianBasqueBelgianBelizeanBermudanBhutaneseBlackfeetBolivianBrazilianBritishBritish West IndianBulgarianBurmeseCajunCambodianCanadianCape VerdeanCarpatho RusynCelticCentral AmericanCentral American IndianCherokeeCheyenneChickasawChileanChineseChippewaChoctawColombianColvilleComancheCosta RicanCreeCreekCroatianCrowCubanCypriotCzechCzechoslovakianDanishDelawareDominicanDutchDutch West IndianEastern EuropeanEcuadorianEgyptianEnglishEstonianEthiopianEuropeanFijianFilipinoFinnishFrenchFrench American IndianFrench CanadianGermanGerman RussianGhanaianGreekGuamanian/ChamorroGuatemalanGuyaneseHaitianHmongHonduranHopiHoumaHungarianIcelanderIndian (Asian)IndonesianInupiatIranianIraqiIrishIroquoisIsraeliItalianJamaicanJapaneseJordanianKenyanKiowaKoreanLaotianLatvianLebaneseLiberianLithuanianLumbeeLuxembourgerMacedonianMalaysianMalteseMarshalleseMenomineeMexicanMexican American IndianMongolianMoroccanNative HawaiianNavajoNepaleseNew ZealanderNicaraguanNigerianNorthern EuropeanNorwegianOkinawanOsageOttawaPaiutePakistaniPalestinianPanamanianParaguayanPennsylvania GermanPeruvianPimaPolishPortuguesePotawatomiPuebloPuerto RicanPuget Sound SalishRomanianRussianSamoanScandinavianScotch-IrishScottishSeminoleSenegaleseSerbianShoshoneSierra LeoneanSiouxSlavicSlovakSloveneSomaliSouth AfricanSouth AmericanSouth American IndianSoviet UnionSpaniardSpanishSpanish AmericanSpanish American IndianSri LankanSubsaharan AfricanSudaneseSwedishSwissSyrianTaiwaneseThaiTlingit-HaidaTohono O'OdhamTonganTrinidadian and TobagonianTsimshianTurkishU.S. Virgin IslanderUgandanUkrainianUruguayanUteVenezuelanVietnameseWelshWest IndianYakamaYaquiYugoslavianYumanYup'ikZimbabwean
Immigration
NonimmigrantsImmigrantsAfghanistanAfricaAlbaniaArgentinaArmeniaAsiaAustraliaAustriaBahamasBangladeshBarbadosBelarusBelgiumBelizeBoliviaBosnia and HerzegovinaBrazilBulgariaBurma/MyanmarCabo VerdeCambodiaCameroonCanadaCaribbeanCentral AmericaChileChinaColombiaCongoCosta RicaCroatiaCubaCzechoslovakiaDenmarkDominicaDominican RepublicEastern AfricaEastern AsiaEastern EuropeEcuadorEgyptEl SalvadorEnglandEritreaEthiopiaEuropeFijiFranceGermanyGhanaGreeceGrenadaGuatemalaGuyanaHaitiHondurasHong KongHungaryIndiaIndonesiaIranIraqIrelandIsraelItalyJamaicaJapanJordanKazakhstanKenyaKoreaKuwaitLaosLatin AmericaLatviaLebanonLiberiaLithuaniaMalaysiaMexicoMicronesiaMiddle AfricaMoldovaMoroccoNepalNetherlandsNicaraguaNigeriaNorth AmericaNorth MacedoniaNorthern AfricaNorthern EuropeNorwayOceaniaPakistanPanamaPeruPhilippinesPolandPortugalRomaniaRussiaSaudi ArabiaScotlandSenegalSerbiaSierra LeoneSingaporeSomaliaSouth AfricaSouth AmericaSouth Central AsiaSouth Eastern AsiaSouthern EuropeSpainSri LankaSt. Vincent and the GrenadinesSudanSwedenSwitzerlandSyriaTaiwanThailandTrinidad and TobagoTurkeyUgandaUkraineUruguayUzbekistanVenezuelaVietnamWest IndiesWestern AfricaWestern AsiaWestern EuropeYemenZaireZimbabweAzores
Salvadoran
Race
Ancestry
AfghanAfricanAlaska NativeAlaskan AthabascanAlbanianAleutAlsatianAmericanApacheArabArapahoArgentineanArmenianAssyrian/Chaldean/SyriacAustralianAustrianBahamianBangladeshiBarbadianBasqueBelgianBelizeanBermudanBhutaneseBlackfeetBolivianBrazilianBritishBritish West IndianBulgarianBurmeseCajunCambodianCanadianCape VerdeanCarpatho RusynCelticCentral AmericanCentral American IndianCherokeeCheyenneChickasawChileanChineseChippewaChoctawColombianColvilleComancheCosta RicanCreeCreekCroatianCrowCubanCypriotCzechCzechoslovakianDanishDelawareDominicanDutchDutch West IndianEastern EuropeanEcuadorianEgyptianEnglishEstonianEthiopianEuropeanFijianFilipinoFinnishFrenchFrench American IndianFrench CanadianGermanGerman RussianGhanaianGreekGuamanian/ChamorroGuatemalanGuyaneseHaitianHmongHonduranHopiHoumaHungarianIcelanderIndian (Asian)IndonesianInupiatIranianIraqiIrishIroquoisIsraeliItalianJamaicanJapaneseJordanianKenyanKiowaKoreanLaotianLatvianLebaneseLiberianLithuanianLumbeeLuxembourgerMacedonianMalaysianMalteseMarshalleseMenomineeMexicanMexican American IndianMongolianMoroccanNative HawaiianNavajoNepaleseNew ZealanderNicaraguanNigerianNorthern EuropeanNorwegianOkinawanOsageOttawaPaiutePakistaniPalestinianPanamanianParaguayanPennsylvania GermanPeruvianPimaPolishPortuguesePotawatomiPuebloPuerto RicanPuget Sound SalishRomanianRussianSalvadoranSamoanScandinavianScotch-IrishScottishSeminoleSenegaleseSerbianShoshoneSierra LeoneanSiouxSlavicSlovakSloveneSomaliSouth AfricanSouth AmericanSouth American IndianSoviet UnionSpaniardSpanishSpanish AmericanSpanish American IndianSubsaharan AfricanSudaneseSwedishSwissSyrianTaiwaneseThaiTlingit-HaidaTohono O'OdhamTonganTrinidadian and TobagonianTsimshianTurkishU.S. Virgin IslanderUgandanUkrainianUruguayanUteVenezuelanVietnameseWelshWest IndianYakamaYaquiYugoslavianYumanYup'ikZimbabwean
Immigration
NonimmigrantsImmigrantsAfghanistanAfricaAlbaniaArgentinaArmeniaAsiaAustraliaAustriaBahamasBangladeshBarbadosBelarusBelgiumBelizeBoliviaBosnia and HerzegovinaBrazilBulgariaBurma/MyanmarCabo VerdeCambodiaCameroonCanadaCaribbeanCentral AmericaChileChinaColombiaCongoCosta RicaCroatiaCubaCzechoslovakiaDenmarkDominicaDominican RepublicEastern AfricaEastern AsiaEastern EuropeEcuadorEgyptEl SalvadorEnglandEritreaEthiopiaEuropeFijiFranceGermanyGhanaGreeceGrenadaGuatemalaGuyanaHaitiHondurasHong KongHungaryIndiaIndonesiaIranIraqIrelandIsraelItalyJamaicaJapanJordanKazakhstanKenyaKoreaKuwaitLaosLatin AmericaLatviaLebanonLiberiaLithuaniaMalaysiaMexicoMicronesiaMiddle AfricaMoldovaMoroccoNepalNetherlandsNicaraguaNigeriaNorth AmericaNorth MacedoniaNorthern AfricaNorthern EuropeNorwayOceaniaPakistanPanamaPeruPhilippinesPolandPortugalRomaniaRussiaSaudi ArabiaScotlandSenegalSerbiaSierra LeoneSingaporeSomaliaSouth AfricaSouth AmericaSouth Central AsiaSouth Eastern AsiaSouthern EuropeSpainSri LankaSt. Vincent and the GrenadinesSudanSwedenSwitzerlandSyriaTaiwanThailandTrinidad and TobagoTurkeyUgandaUkraineUruguayUzbekistanVenezuelaVietnamWest IndiesWestern AfricaWestern AsiaWestern EuropeYemenZaireZimbabweAzores
Unemployment Among Ages 16 to 19 years
Income
Poverty
Unemployment
Labor Participation
Family Structure
Vehicle Availability
Education Level
Disability

Unemployment Among Ages 16 to 19 years Comparison

Sri Lankans

Salvadorans

Exceptional
Tragic
16.5%
UNEMPLOYMENT AMONG AGES 16 TO 19 YEARS
99.5/ 100
METRIC RATING
56th/ 347
METRIC RANK
18.9%
UNEMPLOYMENT AMONG AGES 16 TO 19 YEARS
0.1/ 100
METRIC RATING
262nd/ 347
METRIC RANK

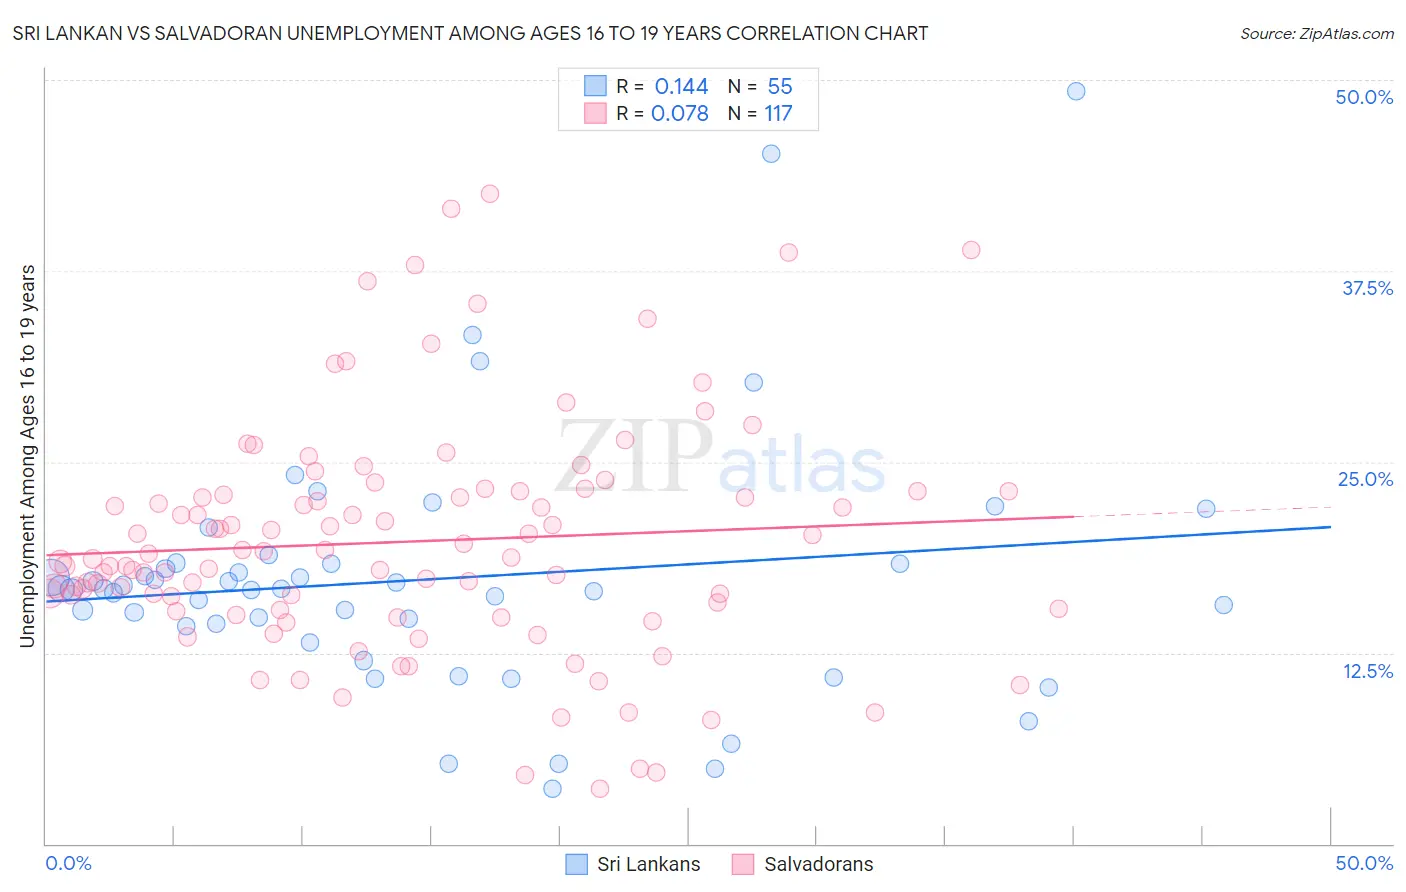
Sri Lankan vs Salvadoran Unemployment Among Ages 16 to 19 years Correlation Chart

The statistical analysis conducted on geographies consisting of 416,928,675 people shows a poor positive correlation between the proportion of Sri Lankans and unemployment rate among population between the ages 16 and 19 in the United States with a correlation coefficient (R) of 0.144 and weighted average of 16.5%. Similarly, the statistical analysis conducted on geographies consisting of 380,157,558 people shows a slight positive correlation between the proportion of Salvadorans and unemployment rate among population between the ages 16 and 19 in the United States with a correlation coefficient (R) of 0.078 and weighted average of 18.9%, a difference of 15.0%.
Sri Lankan vs Salvadoran Unemployment Among Ages 16 to 19 years

Unemployment Among Ages 16 to 19 years Correlation Summary

MeasurementSri LankanSalvadoran
Minimum3.6%3.6%
Maximum49.3%42.5%
Range45.7%38.9%
Mean17.3%19.8%
Median16.7%18.7%
Interquartile 25% (IQ1)14.2%15.4%
Interquartile 75% (IQ3)18.3%23.1%
Interquartile Range (IQR)4.1%7.7%
Standard Deviation (Sample)8.3%7.6%
Standard Deviation (Population)8.3%7.6%

Similar Demographics by Unemployment Among Ages 16 to 19 years

Demographics Similar to Sri Lankans by Unemployment Among Ages 16 to 19 years

In terms of unemployment among ages 16 to 19 years, the demographic groups most similar to Sri Lankans are Czechoslovakian (16.5%, a difference of 0.020%), British (16.5%, a difference of 0.050%), Slovene (16.4%, a difference of 0.10%), Welsh (16.4%, a difference of 0.18%), and Lebanese (16.4%, a difference of 0.22%).
DemographicsRating | RankUnemployment Among Ages 16 to 19 years
Iraqis
99.7
/100
|
#49
Exceptional
16.4%
Bhutanese
99.6
/100
|
#50
Exceptional
16.4%
Lebanese
99.6
/100
|
#51
Exceptional
16.4%
Welsh
99.6
/100
|
#52
Exceptional
16.4%
Slovenes
99.6
/100
|
#53
Exceptional
16.4%
British
99.5
/100
|
#54
Exceptional
16.5%
Czechoslovakians
99.5
/100
|
#55
Exceptional
16.5%
Sri Lankans
99.5
/100
|
#56
Exceptional
16.5%
Immigrants | Jordan
99.4
/100
|
#57
Exceptional
16.5%
Immigrants | Uganda
99.4
/100
|
#58
Exceptional
16.5%
Irish
99.4
/100
|
#59
Exceptional
16.5%
Menominee
99.3
/100
|
#60
Exceptional
16.6%
Immigrants | Cuba
99.2
/100
|
#61
Exceptional
16.6%
Macedonians
99.2
/100
|
#62
Exceptional
16.6%
Scotch-Irish
99.1
/100
|
#63
Exceptional
16.6%

Demographics Similar to Salvadorans by Unemployment Among Ages 16 to 19 years

In terms of unemployment among ages 16 to 19 years, the demographic groups most similar to Salvadorans are Spanish American Indian (18.9%, a difference of 0.040%), Nigerian (18.9%, a difference of 0.080%), Cree (19.0%, a difference of 0.13%), Immigrants from Central America (18.9%, a difference of 0.16%), and Yaqui (19.0%, a difference of 0.16%).
DemographicsRating | RankUnemployment Among Ages 16 to 19 years
Immigrants | Cameroon
0.3
/100
|
#255
Tragic
18.8%
Mexican American Indians
0.3
/100
|
#256
Tragic
18.8%
Immigrants | Nigeria
0.2
/100
|
#257
Tragic
18.9%
Immigrants | Mexico
0.2
/100
|
#258
Tragic
18.9%
Immigrants | Central America
0.2
/100
|
#259
Tragic
18.9%
Nigerians
0.2
/100
|
#260
Tragic
18.9%
Spanish American Indians
0.1
/100
|
#261
Tragic
18.9%
Salvadorans
0.1
/100
|
#262
Tragic
18.9%
Cree
0.1
/100
|
#263
Tragic
19.0%
Yaqui
0.1
/100
|
#264
Tragic
19.0%
Choctaw
0.1
/100
|
#265
Tragic
19.0%
Immigrants | Honduras
0.1
/100
|
#266
Tragic
19.0%
Israelis
0.1
/100
|
#267
Tragic
19.0%
Immigrants | El Salvador
0.1
/100
|
#268
Tragic
19.1%
Lumbee
0.1
/100
|
#269
Tragic
19.1%