Spanish vs South American Indian Unemployment Among Youth under 25 years

COMPARE

Spanish
Race
Ancestry
AfghanAfricanAlaska NativeAlaskan AthabascanAlbanianAleutAlsatianAmericanApacheArabArapahoArgentineanArmenianAssyrian/Chaldean/SyriacAustralianAustrianBahamianBangladeshiBarbadianBasqueBelgianBelizeanBermudanBhutaneseBlackfeetBolivianBrazilianBritishBritish West IndianBulgarianBurmeseCajunCambodianCanadianCape VerdeanCarpatho RusynCelticCentral AmericanCentral American IndianCherokeeCheyenneChickasawChileanChineseChippewaChoctawColombianColvilleComancheCosta RicanCreeCreekCroatianCrowCubanCypriotCzechCzechoslovakianDanishDelawareDominicanDutchDutch West IndianEastern EuropeanEcuadorianEgyptianEnglishEstonianEthiopianEuropeanFijianFilipinoFinnishFrenchFrench American IndianFrench CanadianGermanGerman RussianGhanaianGreekGuamanian/ChamorroGuatemalanGuyaneseHaitianHmongHonduranHopiHoumaHungarianIcelanderIndian (Asian)IndonesianInupiatIranianIraqiIrishIroquoisIsraeliItalianJamaicanJapaneseJordanianKenyanKiowaKoreanLaotianLatvianLebaneseLiberianLithuanianLumbeeLuxembourgerMacedonianMalaysianMalteseMarshalleseMenomineeMexicanMexican American IndianMongolianMoroccanNative HawaiianNavajoNepaleseNew ZealanderNicaraguanNigerianNorthern EuropeanNorwegianOkinawanOsageOttawaPaiutePakistaniPalestinianPanamanianParaguayanPennsylvania GermanPeruvianPimaPolishPortuguesePotawatomiPuebloPuerto RicanPuget Sound SalishRomanianRussianSalvadoranSamoanScandinavianScotch-IrishScottishSeminoleSenegaleseSerbianShoshoneSierra LeoneanSiouxSlavicSlovakSloveneSomaliSouth AfricanSouth AmericanSoviet UnionSpaniardSpanishSpanish AmericanSpanish American IndianSri LankanSubsaharan AfricanSudaneseSwedishSwissSyrianTaiwaneseThaiTlingit-HaidaTohono O'OdhamTonganTrinidadian and TobagonianTsimshianTurkishU.S. Virgin IslanderUgandanUkrainianUruguayanUteVenezuelanVietnameseWelshWest IndianYakamaYaquiYugoslavianYumanYup'ikZimbabwean
Immigration
NonimmigrantsImmigrantsAfghanistanAfricaAlbaniaArgentinaArmeniaAsiaAustraliaAustriaBahamasBangladeshBarbadosBelarusBelgiumBelizeBoliviaBosnia and HerzegovinaBrazilBulgariaBurma/MyanmarCabo VerdeCambodiaCameroonCanadaCaribbeanCentral AmericaChileChinaColombiaCongoCosta RicaCroatiaCubaCzechoslovakiaDenmarkDominicaDominican RepublicEastern AfricaEastern AsiaEastern EuropeEcuadorEgyptEl SalvadorEnglandEritreaEthiopiaEuropeFijiFranceGermanyGhanaGreeceGrenadaGuatemalaGuyanaHaitiHondurasHong KongHungaryIndiaIndonesiaIranIraqIrelandIsraelItalyJamaicaJapanJordanKazakhstanKenyaKoreaKuwaitLaosLatin AmericaLatviaLebanonLiberiaLithuaniaMalaysiaMexicoMicronesiaMiddle AfricaMoldovaMoroccoNepalNetherlandsNicaraguaNigeriaNorth AmericaNorth MacedoniaNorthern AfricaNorthern EuropeNorwayOceaniaPakistanPanamaPeruPhilippinesPolandPortugalRomaniaRussiaSaudi ArabiaScotlandSenegalSerbiaSierra LeoneSingaporeSomaliaSouth AfricaSouth AmericaSouth Central AsiaSouth Eastern AsiaSouthern EuropeSpainSri LankaSt. Vincent and the GrenadinesSudanSwedenSwitzerlandSyriaTaiwanThailandTrinidad and TobagoTurkeyUgandaUkraineUruguayUzbekistanVenezuelaVietnamWest IndiesWestern AfricaWestern AsiaWestern EuropeYemenZaireZimbabweAzores
South American Indian
Race
Ancestry
AfghanAfricanAlaska NativeAlaskan AthabascanAlbanianAleutAlsatianAmericanApacheArabArapahoArgentineanArmenianAssyrian/Chaldean/SyriacAustralianAustrianBahamianBangladeshiBarbadianBasqueBelgianBelizeanBermudanBhutaneseBlackfeetBolivianBrazilianBritishBritish West IndianBulgarianBurmeseCajunCambodianCanadianCape VerdeanCarpatho RusynCelticCentral AmericanCentral American IndianCherokeeCheyenneChickasawChileanChineseChippewaChoctawColombianColvilleComancheCosta RicanCreeCreekCroatianCrowCubanCypriotCzechCzechoslovakianDanishDelawareDominicanDutchDutch West IndianEastern EuropeanEcuadorianEgyptianEnglishEstonianEthiopianEuropeanFijianFilipinoFinnishFrenchFrench American IndianFrench CanadianGermanGerman RussianGhanaianGreekGuamanian/ChamorroGuatemalanGuyaneseHaitianHmongHonduranHopiHoumaHungarianIcelanderIndian (Asian)IndonesianInupiatIranianIraqiIrishIroquoisIsraeliItalianJamaicanJapaneseJordanianKenyanKiowaKoreanLaotianLatvianLebaneseLiberianLithuanianLumbeeLuxembourgerMacedonianMalaysianMalteseMarshalleseMenomineeMexicanMexican American IndianMongolianMoroccanNative HawaiianNavajoNepaleseNew ZealanderNicaraguanNigerianNorthern EuropeanNorwegianOkinawanOsageOttawaPaiutePakistaniPalestinianPanamanianParaguayanPennsylvania GermanPeruvianPimaPolishPortuguesePotawatomiPuebloPuerto RicanPuget Sound SalishRomanianRussianSalvadoranSamoanScandinavianScotch-IrishScottishSeminoleSenegaleseSerbianShoshoneSierra LeoneanSiouxSlavicSlovakSloveneSomaliSouth AfricanSouth AmericanSouth American IndianSoviet UnionSpaniardSpanish AmericanSpanish American IndianSri LankanSubsaharan AfricanSudaneseSwedishSwissSyrianTaiwaneseThaiTlingit-HaidaTohono O'OdhamTonganTrinidadian and TobagonianTsimshianTurkishU.S. Virgin IslanderUgandanUkrainianUruguayanUteVenezuelanVietnameseWelshWest IndianYakamaYaquiYugoslavianYumanYup'ikZimbabwean
Immigration
NonimmigrantsImmigrantsAfghanistanAfricaAlbaniaArgentinaArmeniaAsiaAustraliaAustriaBahamasBangladeshBarbadosBelarusBelgiumBelizeBoliviaBosnia and HerzegovinaBrazilBulgariaBurma/MyanmarCabo VerdeCambodiaCameroonCanadaCaribbeanCentral AmericaChileChinaColombiaCongoCosta RicaCroatiaCubaCzechoslovakiaDenmarkDominicaDominican RepublicEastern AfricaEastern AsiaEastern EuropeEcuadorEgyptEl SalvadorEnglandEritreaEthiopiaEuropeFijiFranceGermanyGhanaGreeceGrenadaGuatemalaGuyanaHaitiHondurasHong KongHungaryIndiaIndonesiaIranIraqIrelandIsraelItalyJamaicaJapanJordanKazakhstanKenyaKoreaKuwaitLaosLatin AmericaLatviaLebanonLiberiaLithuaniaMalaysiaMexicoMicronesiaMiddle AfricaMoldovaMoroccoNepalNetherlandsNicaraguaNigeriaNorth AmericaNorth MacedoniaNorthern AfricaNorthern EuropeNorwayOceaniaPakistanPanamaPeruPhilippinesPolandPortugalRomaniaRussiaSaudi ArabiaScotlandSenegalSerbiaSierra LeoneSingaporeSomaliaSouth AfricaSouth AmericaSouth Central AsiaSouth Eastern AsiaSouthern EuropeSpainSri LankaSt. Vincent and the GrenadinesSudanSwedenSwitzerlandSyriaTaiwanThailandTrinidad and TobagoTurkeyUgandaUkraineUruguayUzbekistanVenezuelaVietnamWest IndiesWestern AfricaWestern AsiaWestern EuropeYemenZaireZimbabweAzores
Unemployment Among Youth under 25 years
Income
Poverty
Unemployment
Labor Participation
Family Structure
Vehicle Availability
Education Level
Disability

Unemployment Among Youth under 25 years Comparison

Spanish

South American Indians

Good
Tragic
11.6%
UNEMPLOYMENT AMONG YOUTH UNDER 25 YEARS
60.3/ 100
METRIC RATING
166th/ 347
METRIC RANK
12.1%
UNEMPLOYMENT AMONG YOUTH UNDER 25 YEARS
1.6/ 100
METRIC RATING
233rd/ 347
METRIC RANK

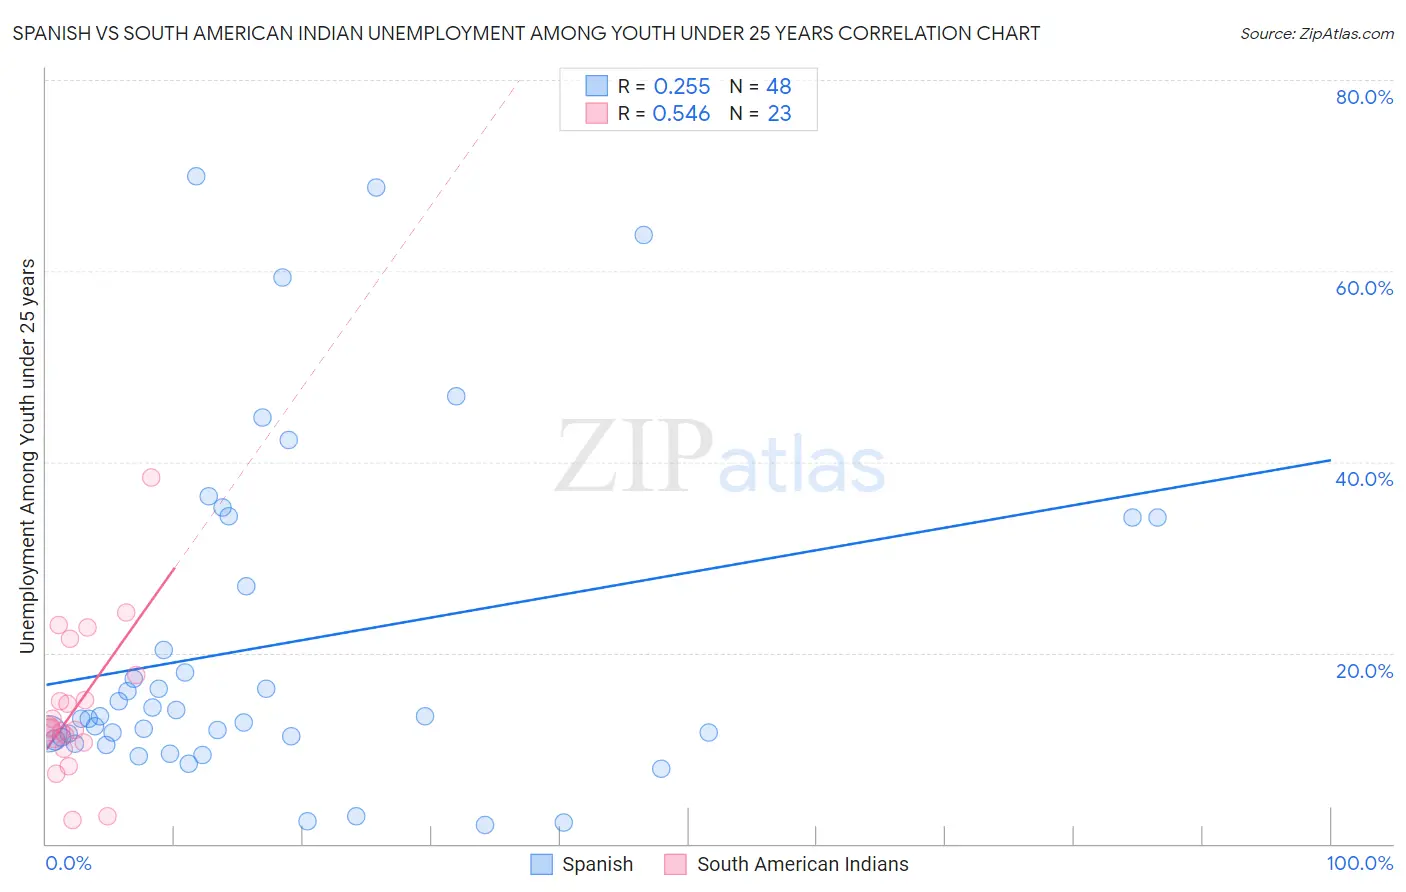
Spanish vs South American Indian Unemployment Among Youth under 25 years Correlation Chart

The statistical analysis conducted on geographies consisting of 415,785,433 people shows a weak positive correlation between the proportion of Spanish and unemployment rate among youth under the age of 25 in the United States with a correlation coefficient (R) of 0.255 and weighted average of 11.6%. Similarly, the statistical analysis conducted on geographies consisting of 164,135,227 people shows a substantial positive correlation between the proportion of South American Indians and unemployment rate among youth under the age of 25 in the United States with a correlation coefficient (R) of 0.546 and weighted average of 12.1%, a difference of 4.7%.
Spanish vs South American Indian Unemployment Among Youth under 25 years

Unemployment Among Youth under 25 years Correlation Summary

MeasurementSpanishSouth American Indian
Minimum2.0%2.5%
Maximum69.9%38.4%
Range67.9%35.9%
Mean20.8%14.3%
Median13.2%12.1%
Interquartile 25% (IQ1)11.0%10.6%
Interquartile 75% (IQ3)30.6%17.7%
Interquartile Range (IQR)19.6%7.1%
Standard Deviation (Sample)17.5%7.8%
Standard Deviation (Population)17.3%7.6%

Similar Demographics by Unemployment Among Youth under 25 years

Demographics Similar to Spanish by Unemployment Among Youth under 25 years

In terms of unemployment among youth under 25 years, the demographic groups most similar to Spanish are Immigrants from Sweden (11.5%, a difference of 0.040%), Okinawan (11.6%, a difference of 0.070%), Immigrants from Laos (11.5%, a difference of 0.090%), Immigrants from Kazakhstan (11.5%, a difference of 0.10%), and Immigrants from Northern Africa (11.5%, a difference of 0.11%).
DemographicsRating | RankUnemployment Among Youth under 25 years
Immigrants | Western Europe
64.7
/100
|
#159
Good
11.5%
Immigrants | Eastern Asia
64.5
/100
|
#160
Good
11.5%
Ukrainians
64.3
/100
|
#161
Good
11.5%
Immigrants | Northern Africa
62.7
/100
|
#162
Good
11.5%
Immigrants | Kazakhstan
62.7
/100
|
#163
Good
11.5%
Immigrants | Laos
62.4
/100
|
#164
Good
11.5%
Immigrants | Sweden
61.3
/100
|
#165
Good
11.5%
Spanish
60.3
/100
|
#166
Good
11.6%
Okinawans
58.7
/100
|
#167
Average
11.6%
Potawatomi
57.9
/100
|
#168
Average
11.6%
Eastern Europeans
57.5
/100
|
#169
Average
11.6%
Russians
57.3
/100
|
#170
Average
11.6%
Bangladeshis
55.6
/100
|
#171
Average
11.6%
Immigrants | Morocco
55.1
/100
|
#172
Average
11.6%
Immigrants | South Eastern Asia
51.7
/100
|
#173
Average
11.6%

Demographics Similar to South American Indians by Unemployment Among Youth under 25 years

In terms of unemployment among youth under 25 years, the demographic groups most similar to South American Indians are Immigrants from Belarus (12.1%, a difference of 0.020%), Immigrants from South America (12.1%, a difference of 0.090%), Guatemalan (12.1%, a difference of 0.15%), Immigrants from Guatemala (12.1%, a difference of 0.16%), and Choctaw (12.1%, a difference of 0.19%).
DemographicsRating | RankUnemployment Among Youth under 25 years
Immigrants | Israel
2.6
/100
|
#226
Tragic
12.0%
Immigrants | Iran
2.6
/100
|
#227
Tragic
12.0%
Immigrants | Fiji
2.1
/100
|
#228
Tragic
12.1%
Moroccans
2.1
/100
|
#229
Tragic
12.1%
Choctaw
1.9
/100
|
#230
Tragic
12.1%
Immigrants | South America
1.8
/100
|
#231
Tragic
12.1%
Immigrants | Belarus
1.6
/100
|
#232
Tragic
12.1%
South American Indians
1.6
/100
|
#233
Tragic
12.1%
Guatemalans
1.4
/100
|
#234
Tragic
12.1%
Immigrants | Guatemala
1.4
/100
|
#235
Tragic
12.1%
Immigrants | Immigrants
1.3
/100
|
#236
Tragic
12.1%
Native Hawaiians
1.3
/100
|
#237
Tragic
12.1%
Albanians
1.2
/100
|
#238
Tragic
12.1%
Immigrants | Africa
1.1
/100
|
#239
Tragic
12.1%
Dutch West Indians
1.1
/100
|
#240
Tragic
12.1%