Spanish American vs Nicaraguan Unemployment Among Ages 16 to 19 years
COMPARE
Spanish American
Nicaraguan
Unemployment Among Ages 16 to 19 years
Unemployment Among Ages 16 to 19 years Comparison
Spanish Americans
Nicaraguans
18.2%
UNEMPLOYMENT AMONG AGES 16 TO 19 YEARS
4.7/ 100
METRIC RATING
230th/ 347
METRIC RANK
17.6%
UNEMPLOYMENT AMONG AGES 16 TO 19 YEARS
48.9/ 100
METRIC RATING
176th/ 347
METRIC RANK
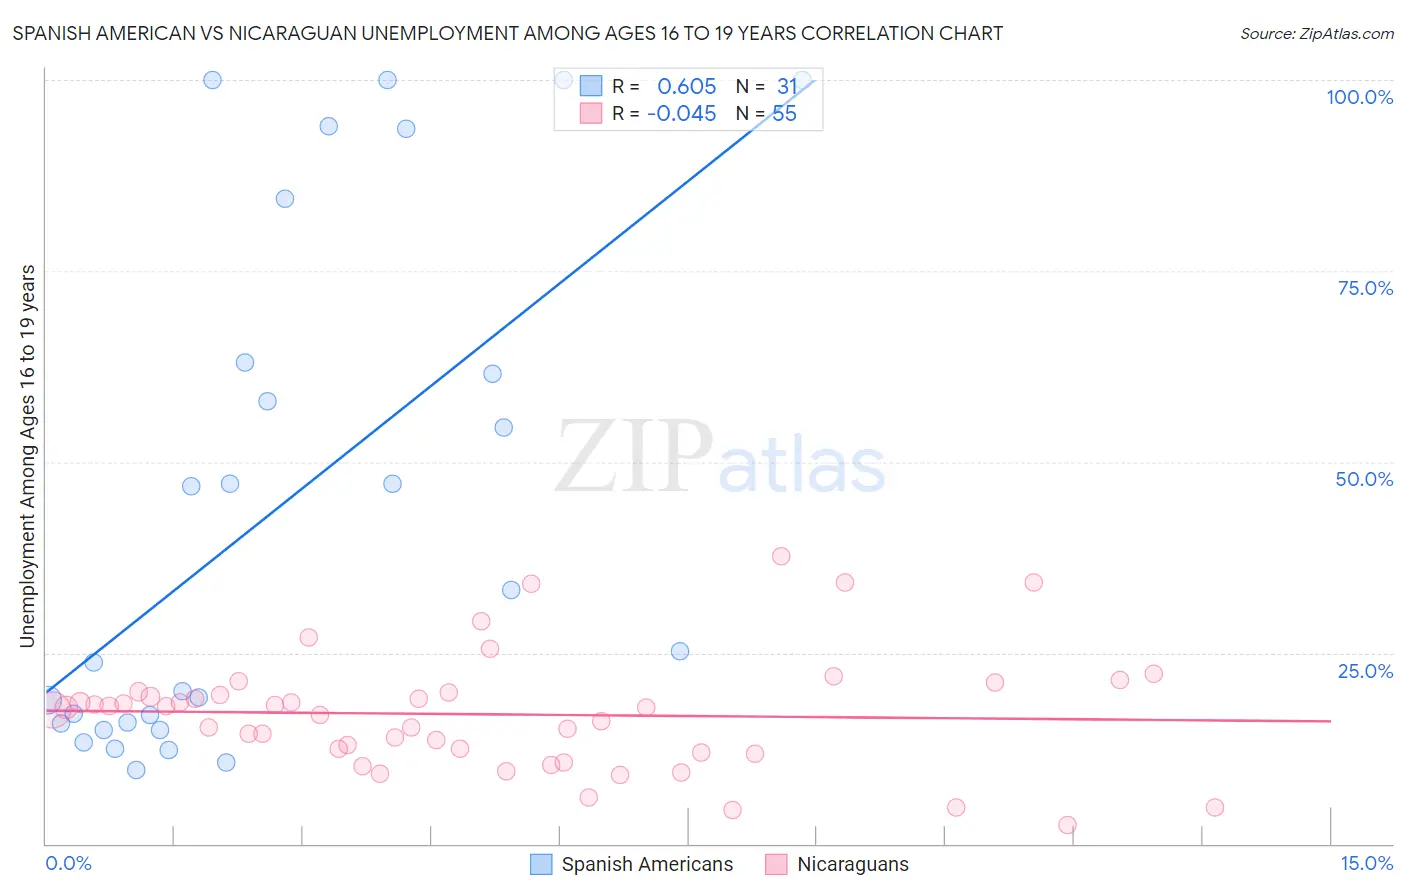
Spanish American vs Nicaraguan Unemployment Among Ages 16 to 19 years Correlation Chart
The statistical analysis conducted on geographies consisting of 101,797,625 people shows a significant positive correlation between the proportion of Spanish Americans and unemployment rate among population between the ages 16 and 19 in the United States with a correlation coefficient (R) of 0.605 and weighted average of 18.2%. Similarly, the statistical analysis conducted on geographies consisting of 277,140,556 people shows no correlation between the proportion of Nicaraguans and unemployment rate among population between the ages 16 and 19 in the United States with a correlation coefficient (R) of -0.045 and weighted average of 17.6%, a difference of 3.5%.
Unemployment Among Ages 16 to 19 years Correlation Summary
| Measurement | Spanish American | Nicaraguan |
| Minimum | 9.7% | 2.4% |
| Maximum | 100.0% | 37.6% |
| Range | 90.3% | 35.2% |
| Mean | 43.3% | 17.0% |
| Median | 25.2% | 17.8% |
| Interquartile 25% (IQ1) | 15.7% | 12.0% |
| Interquartile 75% (IQ3) | 62.9% | 19.9% |
| Interquartile Range (IQR) | 47.2% | 7.9% |
| Standard Deviation (Sample) | 33.1% | 7.6% |
| Standard Deviation (Population) | 32.5% | 7.5% |
Similar Demographics by Unemployment Among Ages 16 to 19 years
Demographics Similar to Spanish Americans by Unemployment Among Ages 16 to 19 years
In terms of unemployment among ages 16 to 19 years, the demographic groups most similar to Spanish Americans are Nepalese (18.2%, a difference of 0.14%), Immigrants from Russia (18.2%, a difference of 0.18%), Seminole (18.2%, a difference of 0.19%), Albanian (18.2%, a difference of 0.26%), and Colombian (18.3%, a difference of 0.29%).
| Demographics | Rating | Rank | Unemployment Among Ages 16 to 19 years |
| Immigrants | Western Asia | 10.2 /100 | #223 | Poor 18.0% |
| Immigrants | Serbia | 8.3 /100 | #224 | Tragic 18.1% |
| Immigrants | Chile | 7.5 /100 | #225 | Tragic 18.1% |
| Immigrants | Belgium | 7.3 /100 | #226 | Tragic 18.1% |
| Immigrants | Liberia | 7.1 /100 | #227 | Tragic 18.1% |
| Immigrants | Greece | 7.1 /100 | #228 | Tragic 18.1% |
| Albanians | 5.8 /100 | #229 | Tragic 18.2% |
| Spanish Americans | 4.7 /100 | #230 | Tragic 18.2% |
| Nepalese | 4.2 /100 | #231 | Tragic 18.2% |
| Immigrants | Russia | 4.0 /100 | #232 | Tragic 18.2% |
| Seminole | 4.0 /100 | #233 | Tragic 18.2% |
| Colombians | 3.7 /100 | #234 | Tragic 18.3% |
| French American Indians | 2.9 /100 | #235 | Tragic 18.3% |
| Immigrants | Colombia | 2.7 /100 | #236 | Tragic 18.3% |
| Immigrants | Immigrants | 2.7 /100 | #237 | Tragic 18.3% |
Demographics Similar to Nicaraguans by Unemployment Among Ages 16 to 19 years
In terms of unemployment among ages 16 to 19 years, the demographic groups most similar to Nicaraguans are Immigrants from Sweden (17.6%, a difference of 0.010%), Bermudan (17.6%, a difference of 0.010%), Celtic (17.6%, a difference of 0.010%), Osage (17.6%, a difference of 0.050%), and American (17.6%, a difference of 0.070%).
| Demographics | Rating | Rank | Unemployment Among Ages 16 to 19 years |
| Immigrants | Cambodia | 54.5 /100 | #169 | Average 17.5% |
| Immigrants | Romania | 53.3 /100 | #170 | Average 17.5% |
| Immigrants | Switzerland | 53.2 /100 | #171 | Average 17.5% |
| Immigrants | Western Europe | 52.2 /100 | #172 | Average 17.6% |
| Chileans | 50.8 /100 | #173 | Average 17.6% |
| Osage | 50.0 /100 | #174 | Average 17.6% |
| Immigrants | Sweden | 49.1 /100 | #175 | Average 17.6% |
| Nicaraguans | 48.9 /100 | #176 | Average 17.6% |
| Bermudans | 48.7 /100 | #177 | Average 17.6% |
| Celtics | 48.7 /100 | #178 | Average 17.6% |
| Americans | 47.4 /100 | #179 | Average 17.6% |
| Spaniards | 47.1 /100 | #180 | Average 17.6% |
| Immigrants | Turkey | 45.6 /100 | #181 | Average 17.6% |
| Russians | 45.2 /100 | #182 | Average 17.6% |
| Immigrants | Uruguay | 44.6 /100 | #183 | Average 17.6% |