Spanish American vs Hungarian Unemployment Among Women with Children Under 6 years

COMPARE

Spanish American
Race
Ancestry
AfghanAfricanAlaska NativeAlaskan AthabascanAlbanianAleutAlsatianAmericanApacheArabArapahoArgentineanArmenianAssyrian/Chaldean/SyriacAustralianAustrianBahamianBangladeshiBarbadianBasqueBelgianBelizeanBermudanBhutaneseBlackfeetBolivianBrazilianBritishBritish West IndianBulgarianBurmeseCajunCambodianCanadianCape VerdeanCarpatho RusynCelticCentral AmericanCentral American IndianCherokeeCheyenneChickasawChileanChineseChippewaChoctawColombianColvilleComancheCosta RicanCreeCreekCroatianCrowCubanCypriotCzechCzechoslovakianDanishDelawareDominicanDutchDutch West IndianEastern EuropeanEcuadorianEgyptianEnglishEstonianEthiopianEuropeanFijianFilipinoFinnishFrenchFrench American IndianFrench CanadianGermanGerman RussianGhanaianGreekGuamanian/ChamorroGuatemalanGuyaneseHaitianHmongHonduranHopiHoumaIcelanderIndian (Asian)IndonesianInupiatIranianIraqiIrishIroquoisIsraeliItalianJamaicanJapaneseJordanianKenyanKiowaKoreanLaotianLatvianLebaneseLiberianLithuanianLumbeeLuxembourgerMacedonianMalaysianMalteseMarshalleseMenomineeMexicanMexican American IndianMongolianMoroccanNative HawaiianNavajoNepaleseNew ZealanderNicaraguanNigerianNorthern EuropeanNorwegianOkinawanOsageOttawaPaiutePakistaniPalestinianPanamanianParaguayanPennsylvania GermanPeruvianPimaPolishPortuguesePotawatomiPuebloPuerto RicanPuget Sound SalishRomanianRussianSalvadoranSamoanScandinavianScotch-IrishScottishSeminoleSenegaleseSerbianShoshoneSierra LeoneanSiouxSlavicSlovakSloveneSomaliSouth AfricanSouth AmericanSouth American IndianSoviet UnionSpaniardSpanishSpanish AmericanSpanish American IndianSri LankanSubsaharan AfricanSudaneseSwedishSwissSyrianTaiwaneseThaiTlingit-HaidaTohono O'OdhamTonganTrinidadian and TobagonianTsimshianTurkishU.S. Virgin IslanderUgandanUkrainianUruguayanUteVenezuelanVietnameseWelshWest IndianYakamaYaquiYugoslavianYumanYup'ikZimbabwean
Immigration
NonimmigrantsImmigrantsAfghanistanAfricaAlbaniaArgentinaArmeniaAsiaAustraliaAustriaBahamasBangladeshBarbadosBelarusBelgiumBelizeBoliviaBosnia and HerzegovinaBrazilBulgariaBurma/MyanmarCabo VerdeCambodiaCameroonCanadaCaribbeanCentral AmericaChileChinaColombiaCongoCosta RicaCroatiaCubaCzechoslovakiaDenmarkDominicaDominican RepublicEastern AfricaEastern AsiaEastern EuropeEcuadorEgyptEl SalvadorEnglandEritreaEthiopiaEuropeFijiFranceGermanyGhanaGreeceGrenadaGuatemalaGuyanaHaitiHondurasHong KongHungaryIndiaIndonesiaIranIraqIrelandIsraelItalyJamaicaJapanJordanKazakhstanKenyaKoreaKuwaitLaosLatin AmericaLatviaLebanonLiberiaLithuaniaMalaysiaMexicoMicronesiaMiddle AfricaMoldovaMoroccoNepalNetherlandsNicaraguaNigeriaNorth AmericaNorth MacedoniaNorthern AfricaNorthern EuropeNorwayOceaniaPakistanPanamaPeruPhilippinesPolandPortugalRomaniaRussiaSaudi ArabiaScotlandSenegalSerbiaSierra LeoneSingaporeSomaliaSouth AfricaSouth AmericaSouth Central AsiaSouth Eastern AsiaSouthern EuropeSpainSri LankaSt. Vincent and the GrenadinesSudanSwedenSwitzerlandSyriaTaiwanThailandTrinidad and TobagoTurkeyUgandaUkraineUruguayUzbekistanVenezuelaVietnamWest IndiesWestern AfricaWestern AsiaWestern EuropeYemenZaireZimbabweAzores
Hungarian
Race
Ancestry
AfghanAfricanAlaska NativeAlaskan AthabascanAlbanianAleutAlsatianAmericanApacheArabArapahoArgentineanArmenianAssyrian/Chaldean/SyriacAustralianAustrianBahamianBangladeshiBarbadianBasqueBelgianBelizeanBermudanBhutaneseBlackfeetBolivianBrazilianBritishBritish West IndianBulgarianBurmeseCajunCambodianCanadianCape VerdeanCarpatho RusynCelticCentral AmericanCentral American IndianCherokeeCheyenneChickasawChileanChineseChippewaChoctawColombianColvilleComancheCosta RicanCreeCreekCroatianCrowCubanCypriotCzechCzechoslovakianDanishDelawareDominicanDutchDutch West IndianEastern EuropeanEcuadorianEgyptianEnglishEstonianEthiopianEuropeanFijianFilipinoFinnishFrenchFrench American IndianFrench CanadianGermanGerman RussianGhanaianGreekGuamanian/ChamorroGuatemalanGuyaneseHaitianHmongHonduranHopiHoumaHungarianIcelanderIndian (Asian)IndonesianInupiatIranianIraqiIrishIroquoisIsraeliItalianJamaicanJapaneseJordanianKenyanKiowaKoreanLaotianLatvianLebaneseLiberianLithuanianLumbeeLuxembourgerMacedonianMalaysianMalteseMarshalleseMenomineeMexicanMexican American IndianMongolianMoroccanNative HawaiianNavajoNepaleseNew ZealanderNicaraguanNigerianNorthern EuropeanNorwegianOkinawanOsageOttawaPaiutePakistaniPalestinianPanamanianParaguayanPennsylvania GermanPeruvianPimaPolishPortuguesePotawatomiPuebloPuerto RicanPuget Sound SalishRomanianRussianSalvadoranSamoanScandinavianScotch-IrishScottishSeminoleSenegaleseSerbianShoshoneSierra LeoneanSiouxSlavicSlovakSloveneSomaliSouth AfricanSouth AmericanSouth American IndianSoviet UnionSpaniardSpanishSpanish American IndianSri LankanSubsaharan AfricanSudaneseSwedishSwissSyrianTaiwaneseThaiTlingit-HaidaTohono O'OdhamTonganTrinidadian and TobagonianTsimshianTurkishU.S. Virgin IslanderUgandanUkrainianUruguayanUteVenezuelanVietnameseWelshWest IndianYakamaYaquiYugoslavianYumanYup'ikZimbabwean
Immigration
NonimmigrantsImmigrantsAfghanistanAfricaAlbaniaArgentinaArmeniaAsiaAustraliaAustriaBahamasBangladeshBarbadosBelarusBelgiumBelizeBoliviaBosnia and HerzegovinaBrazilBulgariaBurma/MyanmarCabo VerdeCambodiaCameroonCanadaCaribbeanCentral AmericaChileChinaColombiaCongoCosta RicaCroatiaCubaCzechoslovakiaDenmarkDominicaDominican RepublicEastern AfricaEastern AsiaEastern EuropeEcuadorEgyptEl SalvadorEnglandEritreaEthiopiaEuropeFijiFranceGermanyGhanaGreeceGrenadaGuatemalaGuyanaHaitiHondurasHong KongHungaryIndiaIndonesiaIranIraqIrelandIsraelItalyJamaicaJapanJordanKazakhstanKenyaKoreaKuwaitLaosLatin AmericaLatviaLebanonLiberiaLithuaniaMalaysiaMexicoMicronesiaMiddle AfricaMoldovaMoroccoNepalNetherlandsNicaraguaNigeriaNorth AmericaNorth MacedoniaNorthern AfricaNorthern EuropeNorwayOceaniaPakistanPanamaPeruPhilippinesPolandPortugalRomaniaRussiaSaudi ArabiaScotlandSenegalSerbiaSierra LeoneSingaporeSomaliaSouth AfricaSouth AmericaSouth Central AsiaSouth Eastern AsiaSouthern EuropeSpainSri LankaSt. Vincent and the GrenadinesSudanSwedenSwitzerlandSyriaTaiwanThailandTrinidad and TobagoTurkeyUgandaUkraineUruguayUzbekistanVenezuelaVietnamWest IndiesWestern AfricaWestern AsiaWestern EuropeYemenZaireZimbabweAzores
Unemployment Among Women with Children Under 6 years
Income
Poverty
Unemployment
Labor Participation
Family Structure
Vehicle Availability
Education Level
Disability

Unemployment Among Women with Children Under 6 years Comparison

Spanish Americans

Hungarians

Fair
Fair
7.7%
UNEMPLOYMENT AMONG WOMEN WITH CHILDREN UNDER 6 YEARS
39.7/ 100
METRIC RATING
185th/ 347
METRIC RANK
7.8%
UNEMPLOYMENT AMONG WOMEN WITH CHILDREN UNDER 6 YEARS
21.2/ 100
METRIC RATING
206th/ 347
METRIC RANK

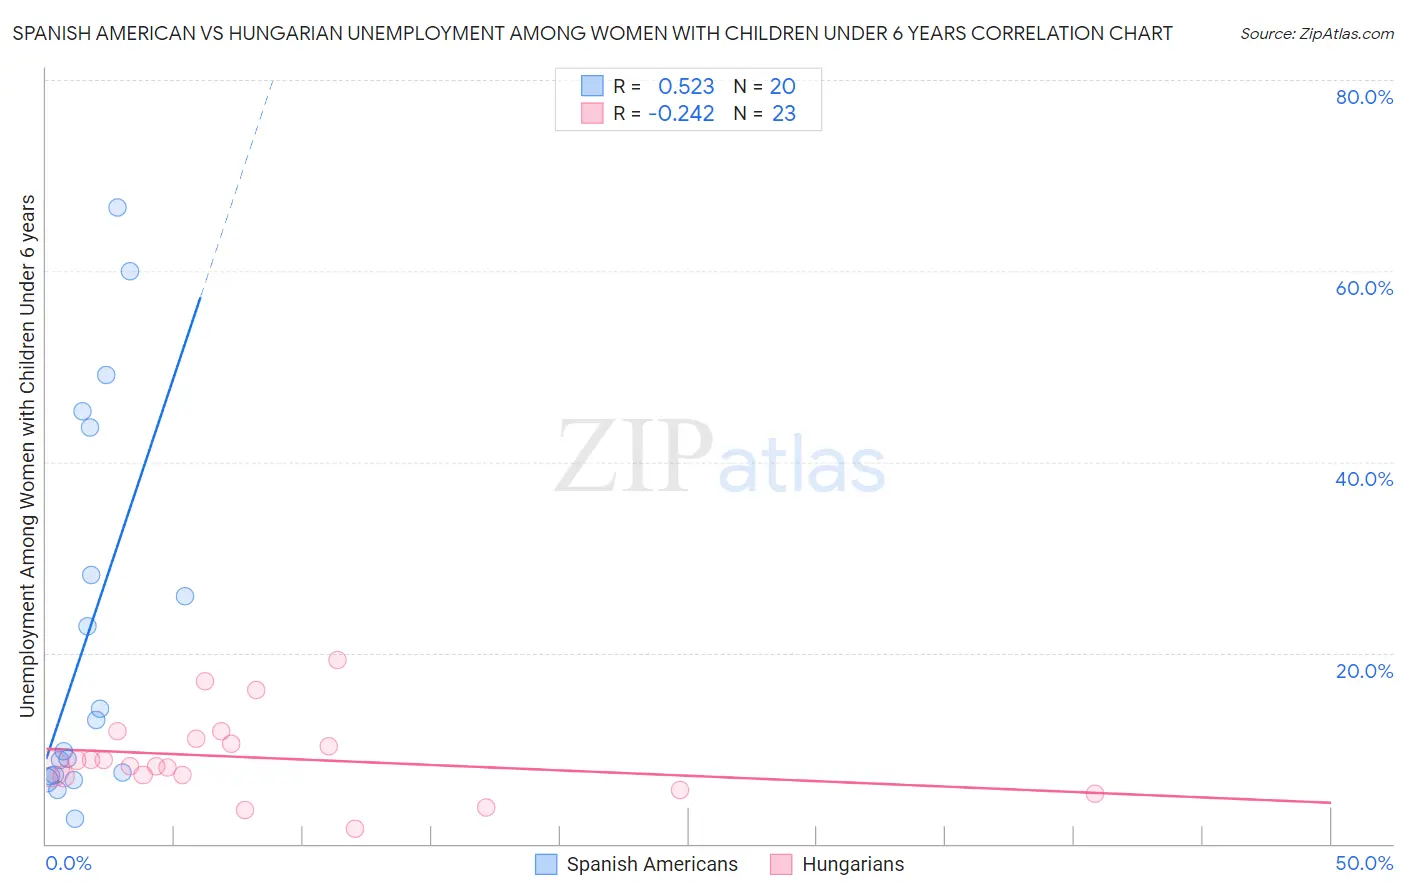
Spanish American vs Hungarian Unemployment Among Women with Children Under 6 years Correlation Chart

The statistical analysis conducted on geographies consisting of 94,405,030 people shows a substantial positive correlation between the proportion of Spanish Americans and unemployment rate among women with children under the age of 6 in the United States with a correlation coefficient (R) of 0.523 and weighted average of 7.7%. Similarly, the statistical analysis conducted on geographies consisting of 341,374,594 people shows a weak negative correlation between the proportion of Hungarians and unemployment rate among women with children under the age of 6 in the United States with a correlation coefficient (R) of -0.242 and weighted average of 7.8%, a difference of 1.5%.
Spanish American vs Hungarian Unemployment Among Women with Children Under 6 years

Unemployment Among Women with Children Under 6 years Correlation Summary

MeasurementSpanish AmericanHungarian
Minimum2.6%1.5%
Maximum66.7%19.3%
Range64.1%17.8%
Mean22.0%9.0%
Median11.3%8.1%
Interquartile 25% (IQ1)7.1%7.1%
Interquartile 75% (IQ3)35.9%11.0%
Interquartile Range (IQR)28.7%3.9%
Standard Deviation (Sample)20.1%4.3%
Standard Deviation (Population)19.6%4.2%

Similar Demographics by Unemployment Among Women with Children Under 6 years

Demographics Similar to Spanish Americans by Unemployment Among Women with Children Under 6 years

In terms of unemployment among women with children under 6 years, the demographic groups most similar to Spanish Americans are Yugoslavian (7.7%, a difference of 0.020%), Indonesian (7.7%, a difference of 0.060%), Immigrants from Thailand (7.7%, a difference of 0.080%), Czechoslovakian (7.7%, a difference of 0.080%), and Sierra Leonean (7.7%, a difference of 0.22%).
DemographicsRating | RankUnemployment Among Women with Children Under 6 years
Immigrants | England
45.4
/100
|
#178
Average
7.7%
Immigrants | Western Europe
44.9
/100
|
#179
Average
7.7%
Immigrants | Uruguay
44.5
/100
|
#180
Average
7.7%
Brazilians
43.9
/100
|
#181
Average
7.7%
Nepalese
43.5
/100
|
#182
Average
7.7%
Sierra Leoneans
42.9
/100
|
#183
Average
7.7%
Indonesians
40.5
/100
|
#184
Average
7.7%
Spanish Americans
39.7
/100
|
#185
Fair
7.7%
Yugoslavians
39.4
/100
|
#186
Fair
7.7%
Immigrants | Thailand
38.5
/100
|
#187
Fair
7.7%
Czechoslovakians
38.4
/100
|
#188
Fair
7.7%
Immigrants | Panama
35.7
/100
|
#189
Fair
7.7%
Immigrants | North Macedonia
34.4
/100
|
#190
Fair
7.7%
Immigrants | Austria
32.4
/100
|
#191
Fair
7.7%
Immigrants | Africa
32.4
/100
|
#192
Fair
7.7%

Demographics Similar to Hungarians by Unemployment Among Women with Children Under 6 years

In terms of unemployment among women with children under 6 years, the demographic groups most similar to Hungarians are Immigrants (7.8%, a difference of 0.020%), Canadian (7.8%, a difference of 0.060%), Lebanese (7.8%, a difference of 0.10%), Spaniard (7.8%, a difference of 0.20%), and Sudanese (7.8%, a difference of 0.22%).
DemographicsRating | RankUnemployment Among Women with Children Under 6 years
Immigrants | Poland
27.3
/100
|
#199
Fair
7.8%
Guamanians/Chamorros
25.5
/100
|
#200
Fair
7.8%
Basques
24.7
/100
|
#201
Fair
7.8%
Sudanese
23.5
/100
|
#202
Fair
7.8%
Spaniards
23.3
/100
|
#203
Fair
7.8%
Lebanese
22.2
/100
|
#204
Fair
7.8%
Immigrants | Immigrants
21.4
/100
|
#205
Fair
7.8%
Hungarians
21.2
/100
|
#206
Fair
7.8%
Canadians
20.6
/100
|
#207
Fair
7.8%
Immigrants | Syria
18.9
/100
|
#208
Poor
7.8%
Costa Ricans
17.6
/100
|
#209
Poor
7.8%
Poles
16.0
/100
|
#210
Poor
7.9%
Immigrants | Ecuador
14.9
/100
|
#211
Poor
7.9%
Swiss
12.3
/100
|
#212
Poor
7.9%
Scottish
11.4
/100
|
#213
Poor
7.9%