Spanish American Indian vs Immigrants from Ireland Unemployment Among Ages 35 to 44 years

COMPARE

Spanish American Indian
Race
Ancestry
AfghanAfricanAlaska NativeAlaskan AthabascanAlbanianAleutAlsatianAmericanApacheArabArapahoArgentineanArmenianAssyrian/Chaldean/SyriacAustralianAustrianBahamianBangladeshiBarbadianBasqueBelgianBelizeanBermudanBhutaneseBlackfeetBolivianBrazilianBritishBritish West IndianBulgarianBurmeseCajunCambodianCanadianCape VerdeanCarpatho RusynCelticCentral AmericanCentral American IndianCherokeeCheyenneChickasawChileanChineseChippewaChoctawColombianColvilleComancheCosta RicanCreeCreekCroatianCrowCubanCypriotCzechCzechoslovakianDanishDelawareDominicanDutchDutch West IndianEastern EuropeanEcuadorianEgyptianEnglishEstonianEthiopianEuropeanFijianFilipinoFinnishFrenchFrench American IndianFrench CanadianGermanGerman RussianGhanaianGreekGuamanian/ChamorroGuatemalanGuyaneseHaitianHmongHonduranHopiHoumaHungarianIcelanderIndian (Asian)IndonesianInupiatIranianIraqiIrishIroquoisIsraeliItalianJamaicanJapaneseJordanianKenyanKiowaKoreanLaotianLatvianLebaneseLiberianLithuanianLumbeeLuxembourgerMacedonianMalaysianMalteseMarshalleseMenomineeMexicanMexican American IndianMongolianMoroccanNative HawaiianNavajoNepaleseNew ZealanderNicaraguanNigerianNorthern EuropeanNorwegianOkinawanOsageOttawaPaiutePakistaniPalestinianPanamanianParaguayanPennsylvania GermanPeruvianPimaPolishPortuguesePotawatomiPuebloPuerto RicanPuget Sound SalishRomanianRussianSalvadoranSamoanScandinavianScotch-IrishScottishSeminoleSenegaleseSerbianShoshoneSierra LeoneanSiouxSlavicSlovakSloveneSomaliSouth AfricanSouth AmericanSouth American IndianSoviet UnionSpaniardSpanishSpanish AmericanSpanish American IndianSri LankanSubsaharan AfricanSudaneseSwedishSwissSyrianTaiwaneseThaiTlingit-HaidaTohono O'OdhamTonganTrinidadian and TobagonianTsimshianTurkishU.S. Virgin IslanderUgandanUkrainianUruguayanUteVenezuelanVietnameseWelshWest IndianYakamaYaquiYugoslavianYumanYup'ikZimbabwean
Immigration
NonimmigrantsImmigrantsAfghanistanAfricaAlbaniaArgentinaArmeniaAsiaAustraliaAustriaBahamasBangladeshBarbadosBelarusBelgiumBelizeBoliviaBosnia and HerzegovinaBrazilBulgariaBurma/MyanmarCabo VerdeCambodiaCameroonCanadaCaribbeanCentral AmericaChileChinaColombiaCongoCosta RicaCroatiaCubaCzechoslovakiaDenmarkDominicaDominican RepublicEastern AfricaEastern AsiaEastern EuropeEcuadorEgyptEl SalvadorEnglandEritreaEthiopiaEuropeFijiFranceGermanyGhanaGreeceGrenadaGuatemalaGuyanaHaitiHondurasHong KongHungaryIndiaIndonesiaIranIraqIsraelItalyJamaicaJapanJordanKazakhstanKenyaKoreaKuwaitLaosLatin AmericaLatviaLebanonLiberiaLithuaniaMalaysiaMexicoMicronesiaMiddle AfricaMoldovaMoroccoNepalNetherlandsNicaraguaNigeriaNorth AmericaNorth MacedoniaNorthern AfricaNorthern EuropeNorwayOceaniaPakistanPanamaPeruPhilippinesPolandPortugalRomaniaRussiaSaudi ArabiaScotlandSenegalSerbiaSierra LeoneSingaporeSomaliaSouth AfricaSouth AmericaSouth Central AsiaSouth Eastern AsiaSouthern EuropeSpainSri LankaSt. Vincent and the GrenadinesSudanSwedenSwitzerlandSyriaTaiwanThailandTrinidad and TobagoTurkeyUgandaUkraineUruguayUzbekistanVenezuelaVietnamWest IndiesWestern AfricaWestern AsiaWestern EuropeYemenZaireZimbabweAzores
Immigrants from Ireland
Race
Ancestry
AfghanAfricanAlaska NativeAlaskan AthabascanAlbanianAleutAlsatianAmericanApacheArabArapahoArgentineanArmenianAssyrian/Chaldean/SyriacAustralianAustrianBahamianBangladeshiBarbadianBasqueBelgianBelizeanBermudanBhutaneseBlackfeetBolivianBrazilianBritishBritish West IndianBulgarianBurmeseCajunCambodianCanadianCape VerdeanCarpatho RusynCelticCentral AmericanCentral American IndianCherokeeCheyenneChickasawChileanChineseChippewaChoctawColombianColvilleComancheCosta RicanCreeCreekCroatianCrowCubanCypriotCzechCzechoslovakianDanishDelawareDominicanDutchDutch West IndianEastern EuropeanEcuadorianEgyptianEnglishEstonianEthiopianEuropeanFijianFilipinoFinnishFrenchFrench American IndianFrench CanadianGermanGerman RussianGhanaianGreekGuamanian/ChamorroGuatemalanGuyaneseHaitianHmongHonduranHopiHoumaHungarianIcelanderIndian (Asian)IndonesianInupiatIranianIraqiIrishIroquoisIsraeliItalianJamaicanJapaneseJordanianKenyanKiowaKoreanLaotianLatvianLebaneseLiberianLithuanianLumbeeLuxembourgerMacedonianMalaysianMalteseMarshalleseMenomineeMexicanMexican American IndianMongolianMoroccanNative HawaiianNavajoNepaleseNew ZealanderNicaraguanNigerianNorthern EuropeanNorwegianOkinawanOsageOttawaPaiutePakistaniPalestinianPanamanianParaguayanPennsylvania GermanPeruvianPimaPolishPortuguesePotawatomiPuebloPuerto RicanPuget Sound SalishRomanianRussianSalvadoranSamoanScandinavianScotch-IrishScottishSeminoleSenegaleseSerbianShoshoneSierra LeoneanSiouxSlavicSlovakSloveneSomaliSouth AfricanSouth AmericanSouth American IndianSoviet UnionSpaniardSpanishSpanish AmericanSri LankanSubsaharan AfricanSudaneseSwedishSwissSyrianTaiwaneseThaiTlingit-HaidaTohono O'OdhamTonganTrinidadian and TobagonianTsimshianTurkishU.S. Virgin IslanderUgandanUkrainianUruguayanUteVenezuelanVietnameseWelshWest IndianYakamaYaquiYugoslavianYumanYup'ikZimbabwean
Immigration
NonimmigrantsImmigrantsAfghanistanAfricaAlbaniaArgentinaArmeniaAsiaAustraliaAustriaBahamasBangladeshBarbadosBelarusBelgiumBelizeBoliviaBosnia and HerzegovinaBrazilBulgariaBurma/MyanmarCabo VerdeCambodiaCameroonCanadaCaribbeanCentral AmericaChileChinaColombiaCongoCosta RicaCroatiaCubaCzechoslovakiaDenmarkDominicaDominican RepublicEastern AfricaEastern AsiaEastern EuropeEcuadorEgyptEl SalvadorEnglandEritreaEthiopiaEuropeFijiFranceGermanyGhanaGreeceGrenadaGuatemalaGuyanaHaitiHondurasHong KongHungaryIndiaIndonesiaIranIraqIrelandIsraelItalyJamaicaJapanJordanKazakhstanKenyaKoreaKuwaitLaosLatin AmericaLatviaLebanonLiberiaLithuaniaMalaysiaMexicoMicronesiaMiddle AfricaMoldovaMoroccoNepalNetherlandsNicaraguaNigeriaNorth AmericaNorth MacedoniaNorthern AfricaNorthern EuropeNorwayOceaniaPakistanPanamaPeruPhilippinesPolandPortugalRomaniaRussiaSaudi ArabiaScotlandSenegalSerbiaSierra LeoneSingaporeSomaliaSouth AfricaSouth AmericaSouth Central AsiaSouth Eastern AsiaSouthern EuropeSpainSri LankaSt. Vincent and the GrenadinesSudanSwedenSwitzerlandSyriaTaiwanThailandTrinidad and TobagoTurkeyUgandaUkraineUruguayUzbekistanVenezuelaVietnamWest IndiesWestern AfricaWestern AsiaWestern EuropeYemenZaireZimbabweAzores
Unemployment Among Ages 35 to 44 years
Income
Poverty
Unemployment
Labor Participation
Family Structure
Vehicle Availability
Education Level
Disability

Unemployment Among Ages 35 to 44 years Comparison

Spanish American Indians

Immigrants from Ireland

Tragic
Exceptional
5.5%
UNEMPLOYMENT AMONG AGES 35 TO 44 YEARS
0.0/ 100
METRIC RATING
289th/ 347
METRIC RANK
4.4%
UNEMPLOYMENT AMONG AGES 35 TO 44 YEARS
96.8/ 100
METRIC RATING
68th/ 347
METRIC RANK

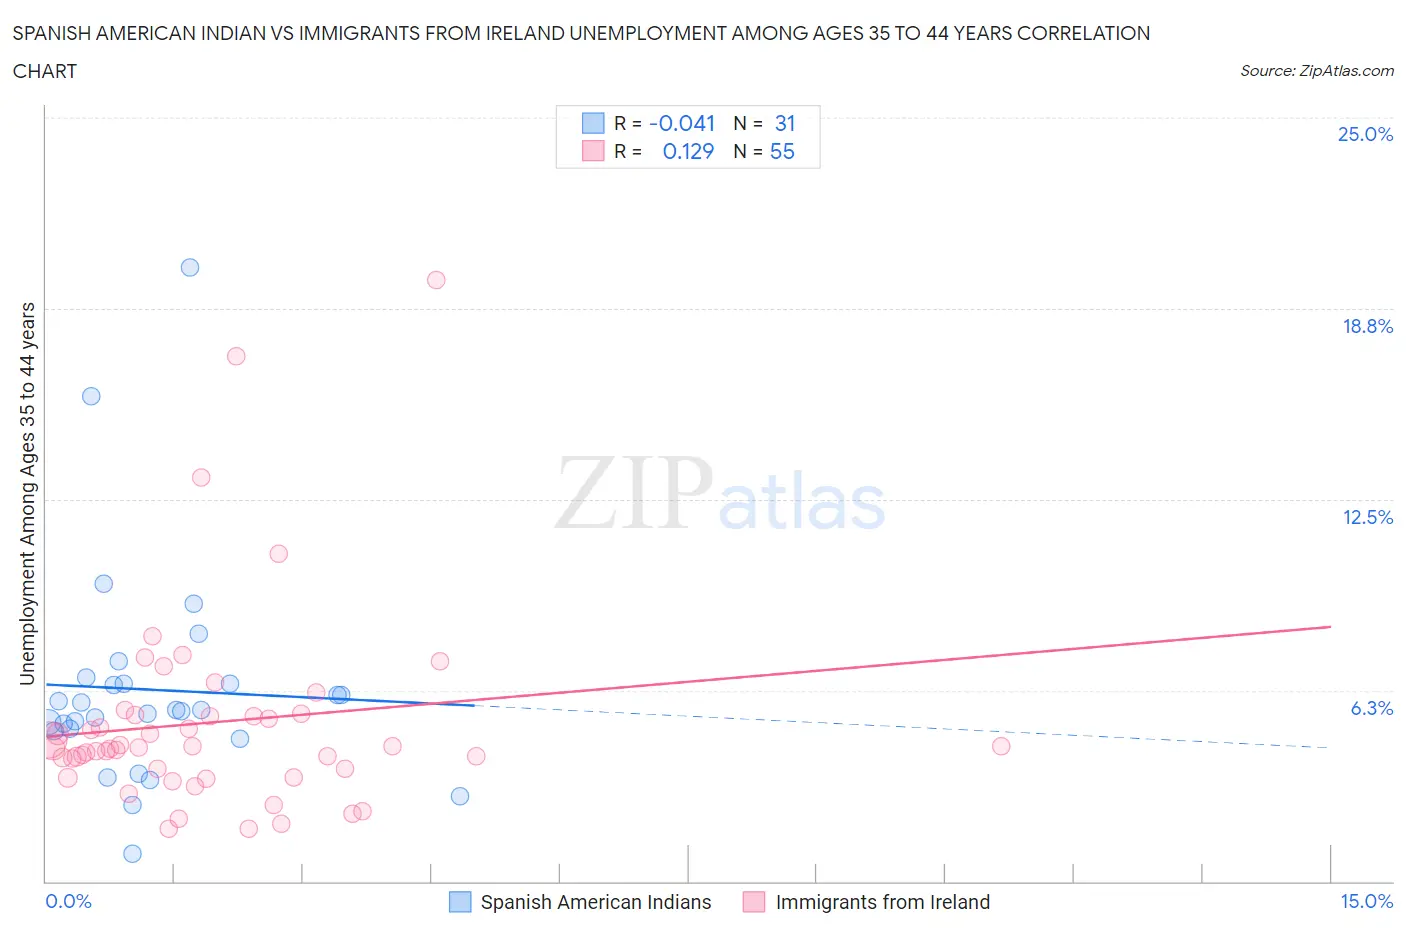
Spanish American Indian vs Immigrants from Ireland Unemployment Among Ages 35 to 44 years Correlation Chart

The statistical analysis conducted on geographies consisting of 72,980,046 people shows no correlation between the proportion of Spanish American Indians and unemployment rate among population between the ages 35 and 44 in the United States with a correlation coefficient (R) of -0.041 and weighted average of 5.5%. Similarly, the statistical analysis conducted on geographies consisting of 237,282,252 people shows a poor positive correlation between the proportion of Immigrants from Ireland and unemployment rate among population between the ages 35 and 44 in the United States with a correlation coefficient (R) of 0.129 and weighted average of 4.4%, a difference of 25.5%.
Spanish American Indian vs Immigrants from Ireland Unemployment Among Ages 35 to 44 years

Unemployment Among Ages 35 to 44 years Correlation Summary

MeasurementSpanish American IndianImmigrants from Ireland
Minimum0.90%1.7%
Maximum20.1%19.7%
Range19.2%18.0%
Mean6.3%5.2%
Median5.6%4.4%
Interquartile 25% (IQ1)4.9%3.7%
Interquartile 75% (IQ3)6.5%5.4%
Interquartile Range (IQR)1.5%1.8%
Standard Deviation (Sample)3.7%3.3%
Standard Deviation (Population)3.6%3.3%

Similar Demographics by Unemployment Among Ages 35 to 44 years

Demographics Similar to Spanish American Indians by Unemployment Among Ages 35 to 44 years

In terms of unemployment among ages 35 to 44 years, the demographic groups most similar to Spanish American Indians are Jamaican (5.5%, a difference of 0.080%), Dutch West Indian (5.5%, a difference of 0.18%), Cree (5.5%, a difference of 0.34%), Immigrants from Haiti (5.5%, a difference of 0.34%), and French American Indian (5.5%, a difference of 0.49%).
DemographicsRating | RankUnemployment Among Ages 35 to 44 years
Immigrants | Ghana
0.0
/100
|
#282
Tragic
5.4%
Immigrants | Ecuador
0.0
/100
|
#283
Tragic
5.4%
Haitians
0.0
/100
|
#284
Tragic
5.5%
Hispanics or Latinos
0.0
/100
|
#285
Tragic
5.5%
Immigrants | Micronesia
0.0
/100
|
#286
Tragic
5.5%
French American Indians
0.0
/100
|
#287
Tragic
5.5%
Cree
0.0
/100
|
#288
Tragic
5.5%
Spanish American Indians
0.0
/100
|
#289
Tragic
5.5%
Jamaicans
0.0
/100
|
#290
Tragic
5.5%
Dutch West Indians
0.0
/100
|
#291
Tragic
5.5%
Immigrants | Haiti
0.0
/100
|
#292
Tragic
5.5%
Central American Indians
0.0
/100
|
#293
Tragic
5.6%
Trinidadians and Tobagonians
0.0
/100
|
#294
Tragic
5.6%
Ottawa
0.0
/100
|
#295
Tragic
5.6%
Immigrants | Trinidad and Tobago
0.0
/100
|
#296
Tragic
5.6%

Demographics Similar to Immigrants from Ireland by Unemployment Among Ages 35 to 44 years

In terms of unemployment among ages 35 to 44 years, the demographic groups most similar to Immigrants from Ireland are Icelander (4.4%, a difference of 0.010%), Argentinean (4.4%, a difference of 0.010%), Slovene (4.4%, a difference of 0.060%), Immigrants from China (4.4%, a difference of 0.060%), and Immigrants from Lithuania (4.4%, a difference of 0.070%).
DemographicsRating | RankUnemployment Among Ages 35 to 44 years
Croatians
97.1
/100
|
#61
Exceptional
4.4%
Immigrants | Bulgaria
97.1
/100
|
#62
Exceptional
4.4%
Austrians
97.1
/100
|
#63
Exceptional
4.4%
Immigrants | Serbia
97.0
/100
|
#64
Exceptional
4.4%
Cambodians
97.0
/100
|
#65
Exceptional
4.4%
Icelanders
96.8
/100
|
#66
Exceptional
4.4%
Argentineans
96.8
/100
|
#67
Exceptional
4.4%
Immigrants | Ireland
96.8
/100
|
#68
Exceptional
4.4%
Slovenes
96.7
/100
|
#69
Exceptional
4.4%
Immigrants | China
96.7
/100
|
#70
Exceptional
4.4%
Immigrants | Lithuania
96.7
/100
|
#71
Exceptional
4.4%
Northern Europeans
96.5
/100
|
#72
Exceptional
4.4%
Lithuanians
96.5
/100
|
#73
Exceptional
4.4%
Poles
96.4
/100
|
#74
Exceptional
4.4%
Immigrants | Romania
96.3
/100
|
#75
Exceptional
4.4%