Soviet Union vs Immigrants from South Africa Unemployment Among Seniors over 65 years
COMPARE
Soviet Union
Immigrants from South Africa
Unemployment Among Seniors over 65 years
Unemployment Among Seniors over 65 years Comparison
Soviet Union
Immigrants from South Africa
5.1%
UNEMPLOYMENT AMONG SENIORS OVER 65 YEARS
90.1/ 100
METRIC RATING
118th/ 347
METRIC RANK
5.0%
UNEMPLOYMENT AMONG SENIORS OVER 65 YEARS
97.6/ 100
METRIC RATING
90th/ 347
METRIC RANK
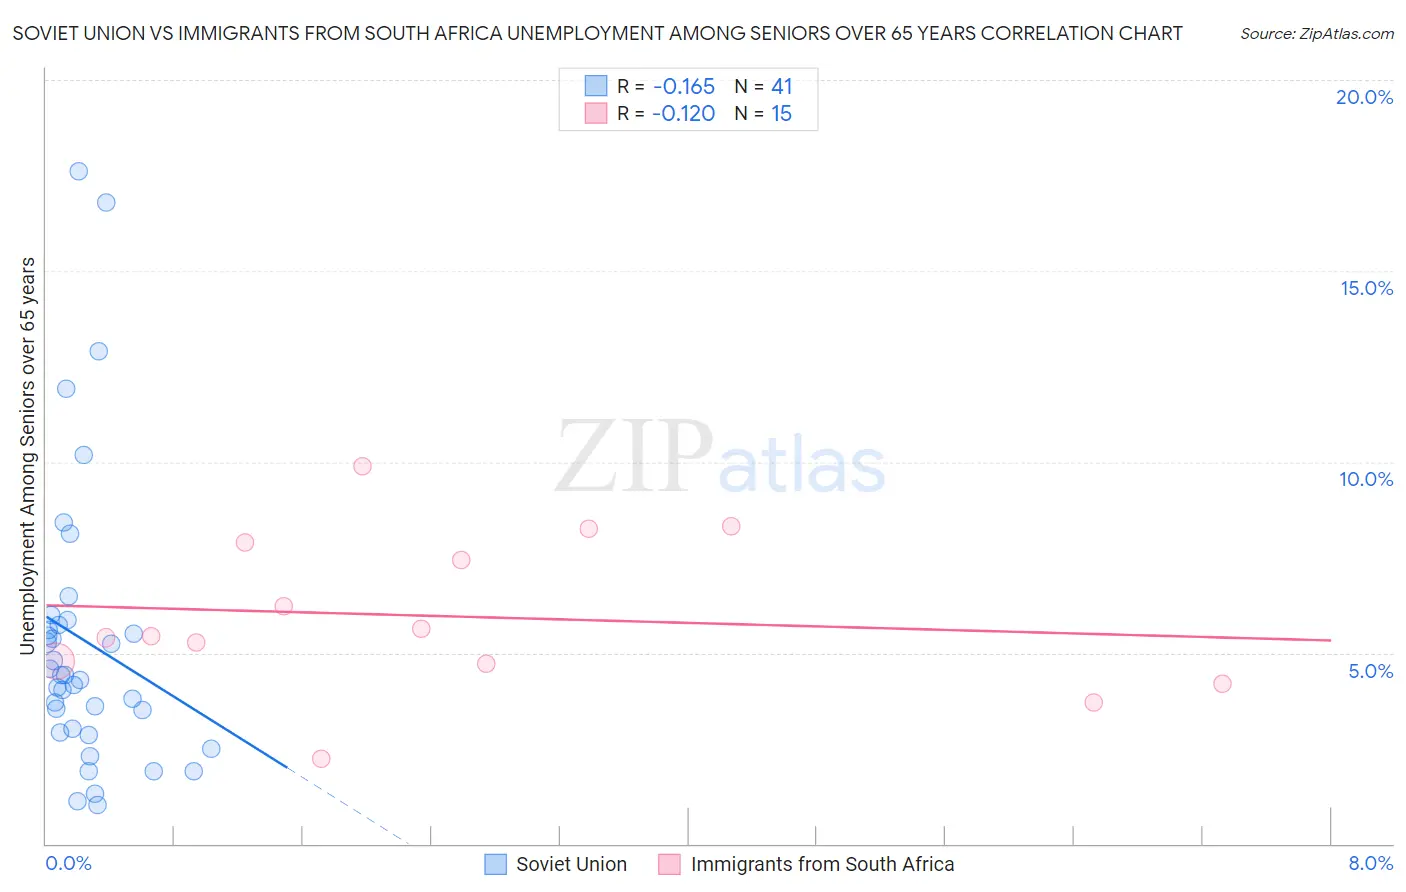
Soviet Union vs Immigrants from South Africa Unemployment Among Seniors over 65 years Correlation Chart
The statistical analysis conducted on geographies consisting of 43,195,045 people shows a poor negative correlation between the proportion of Soviet Union and unemployment rate amomg seniors over the age of 65 in the United States with a correlation coefficient (R) of -0.165 and weighted average of 5.1%. Similarly, the statistical analysis conducted on geographies consisting of 218,473,164 people shows a poor negative correlation between the proportion of Immigrants from South Africa and unemployment rate amomg seniors over the age of 65 in the United States with a correlation coefficient (R) of -0.120 and weighted average of 5.0%, a difference of 1.2%.
Unemployment Among Seniors over 65 years Correlation Summary
| Measurement | Soviet Union | Immigrants from South Africa |
| Minimum | 1.0% | 2.2% |
| Maximum | 17.6% | 9.9% |
| Range | 16.6% | 7.7% |
| Mean | 5.3% | 6.0% |
| Median | 4.4% | 5.4% |
| Interquartile 25% (IQ1) | 3.0% | 4.7% |
| Interquartile 75% (IQ3) | 5.8% | 7.9% |
| Interquartile Range (IQR) | 2.8% | 3.2% |
| Standard Deviation (Sample) | 3.8% | 2.0% |
| Standard Deviation (Population) | 3.7% | 2.0% |
Similar Demographics by Unemployment Among Seniors over 65 years
Demographics Similar to Soviet Union by Unemployment Among Seniors over 65 years
In terms of unemployment among seniors over 65 years, the demographic groups most similar to Soviet Union are Malaysian (5.1%, a difference of 0.030%), Immigrants from Canada (5.1%, a difference of 0.040%), Immigrants from Korea (5.0%, a difference of 0.080%), Celtic (5.0%, a difference of 0.11%), and Seminole (5.0%, a difference of 0.12%).
| Demographics | Rating | Rank | Unemployment Among Seniors over 65 years |
| Finns | 92.2 /100 | #111 | Exceptional 5.0% |
| Eastern Europeans | 92.0 /100 | #112 | Exceptional 5.0% |
| Seminole | 91.4 /100 | #113 | Exceptional 5.0% |
| Immigrants | Latvia | 91.4 /100 | #114 | Exceptional 5.0% |
| Celtics | 91.3 /100 | #115 | Exceptional 5.0% |
| Immigrants | Korea | 91.0 /100 | #116 | Exceptional 5.0% |
| Malaysians | 90.4 /100 | #117 | Exceptional 5.1% |
| Soviet Union | 90.1 /100 | #118 | Exceptional 5.1% |
| Immigrants | Canada | 89.7 /100 | #119 | Excellent 5.1% |
| Irish | 88.8 /100 | #120 | Excellent 5.1% |
| Puget Sound Salish | 88.7 /100 | #121 | Excellent 5.1% |
| Immigrants | Cameroon | 88.6 /100 | #122 | Excellent 5.1% |
| Asians | 88.5 /100 | #123 | Excellent 5.1% |
| Immigrants | North America | 87.9 /100 | #124 | Excellent 5.1% |
| Dutch | 87.6 /100 | #125 | Excellent 5.1% |
Demographics Similar to Immigrants from South Africa by Unemployment Among Seniors over 65 years
In terms of unemployment among seniors over 65 years, the demographic groups most similar to Immigrants from South Africa are Immigrants from South Central Asia (5.0%, a difference of 0.010%), Afghan (5.0%, a difference of 0.020%), Immigrants from Bolivia (5.0%, a difference of 0.080%), Immigrants from Bulgaria (5.0%, a difference of 0.10%), and Austrian (5.0%, a difference of 0.10%).
| Demographics | Rating | Rank | Unemployment Among Seniors over 65 years |
| Immigrants | Zimbabwe | 98.3 /100 | #83 | Exceptional 5.0% |
| Filipinos | 98.3 /100 | #84 | Exceptional 5.0% |
| Immigrants | Hungary | 98.2 /100 | #85 | Exceptional 5.0% |
| Immigrants | Taiwan | 98.2 /100 | #86 | Exceptional 5.0% |
| Immigrants | Switzerland | 98.2 /100 | #87 | Exceptional 5.0% |
| Afghans | 97.6 /100 | #88 | Exceptional 5.0% |
| Immigrants | South Central Asia | 97.6 /100 | #89 | Exceptional 5.0% |
| Immigrants | South Africa | 97.6 /100 | #90 | Exceptional 5.0% |
| Immigrants | Bolivia | 97.3 /100 | #91 | Exceptional 5.0% |
| Immigrants | Bulgaria | 97.3 /100 | #92 | Exceptional 5.0% |
| Austrians | 97.3 /100 | #93 | Exceptional 5.0% |
| Burmese | 96.8 /100 | #94 | Exceptional 5.0% |
| Assyrians/Chaldeans/Syriacs | 96.8 /100 | #95 | Exceptional 5.0% |
| Immigrants | Singapore | 96.8 /100 | #96 | Exceptional 5.0% |
| Immigrants | Oceania | 96.8 /100 | #97 | Exceptional 5.0% |