Soviet Union vs French Canadian Unemployment Among Ages 30 to 34 years

COMPARE

Soviet Union
Race
Ancestry
AfghanAfricanAlaska NativeAlaskan AthabascanAlbanianAleutAlsatianAmericanApacheArabArapahoArgentineanArmenianAssyrian/Chaldean/SyriacAustralianAustrianBahamianBangladeshiBarbadianBasqueBelgianBelizeanBermudanBhutaneseBlackfeetBolivianBrazilianBritishBritish West IndianBulgarianBurmeseCajunCambodianCanadianCape VerdeanCarpatho RusynCelticCentral AmericanCentral American IndianCherokeeCheyenneChickasawChileanChineseChippewaChoctawColombianColvilleComancheCosta RicanCreeCreekCroatianCrowCubanCypriotCzechCzechoslovakianDanishDelawareDominicanDutchDutch West IndianEastern EuropeanEcuadorianEgyptianEnglishEstonianEthiopianEuropeanFijianFilipinoFinnishFrenchFrench American IndianGermanGerman RussianGhanaianGreekGuamanian/ChamorroGuatemalanGuyaneseHaitianHmongHonduranHopiHoumaHungarianIcelanderIndian (Asian)IndonesianInupiatIranianIraqiIrishIroquoisIsraeliItalianJamaicanJapaneseJordanianKenyanKiowaKoreanLaotianLatvianLebaneseLiberianLithuanianLumbeeLuxembourgerMacedonianMalaysianMalteseMarshalleseMenomineeMexicanMexican American IndianMongolianMoroccanNative HawaiianNavajoNepaleseNew ZealanderNicaraguanNigerianNorthern EuropeanNorwegianOkinawanOsageOttawaPaiutePakistaniPalestinianPanamanianParaguayanPennsylvania GermanPeruvianPimaPolishPortuguesePotawatomiPuebloPuerto RicanPuget Sound SalishRomanianRussianSalvadoranSamoanScandinavianScotch-IrishScottishSeminoleSenegaleseSerbianShoshoneSierra LeoneanSiouxSlavicSlovakSloveneSomaliSouth AfricanSouth AmericanSouth American IndianSoviet UnionSpaniardSpanishSpanish AmericanSpanish American IndianSri LankanSubsaharan AfricanSudaneseSwedishSwissSyrianTaiwaneseThaiTlingit-HaidaTohono O'OdhamTonganTrinidadian and TobagonianTsimshianTurkishU.S. Virgin IslanderUgandanUkrainianUruguayanUteVenezuelanVietnameseWelshWest IndianYakamaYaquiYugoslavianYumanYup'ikZimbabwean
Immigration
NonimmigrantsImmigrantsAfghanistanAfricaAlbaniaArgentinaArmeniaAsiaAustraliaAustriaBahamasBangladeshBarbadosBelarusBelgiumBelizeBoliviaBosnia and HerzegovinaBrazilBulgariaBurma/MyanmarCabo VerdeCambodiaCameroonCanadaCaribbeanCentral AmericaChileChinaColombiaCongoCosta RicaCroatiaCubaCzechoslovakiaDenmarkDominicaDominican RepublicEastern AfricaEastern AsiaEastern EuropeEcuadorEgyptEl SalvadorEnglandEritreaEthiopiaEuropeFijiFranceGermanyGhanaGreeceGrenadaGuatemalaGuyanaHaitiHondurasHong KongHungaryIndiaIndonesiaIranIraqIrelandIsraelItalyJamaicaJapanJordanKazakhstanKenyaKoreaKuwaitLaosLatin AmericaLatviaLebanonLiberiaLithuaniaMalaysiaMexicoMicronesiaMiddle AfricaMoldovaMoroccoNepalNetherlandsNicaraguaNigeriaNorth AmericaNorth MacedoniaNorthern AfricaNorthern EuropeNorwayOceaniaPakistanPanamaPeruPhilippinesPolandPortugalRomaniaRussiaSaudi ArabiaScotlandSenegalSerbiaSierra LeoneSingaporeSomaliaSouth AfricaSouth AmericaSouth Central AsiaSouth Eastern AsiaSouthern EuropeSpainSri LankaSt. Vincent and the GrenadinesSudanSwedenSwitzerlandSyriaTaiwanThailandTrinidad and TobagoTurkeyUgandaUkraineUruguayUzbekistanVenezuelaVietnamWest IndiesWestern AfricaWestern AsiaWestern EuropeYemenZaireZimbabweAzores
French Canadian
Race
Ancestry
AfghanAfricanAlaska NativeAlaskan AthabascanAlbanianAleutAlsatianAmericanApacheArabArapahoArgentineanArmenianAssyrian/Chaldean/SyriacAustralianAustrianBahamianBangladeshiBarbadianBasqueBelgianBelizeanBermudanBhutaneseBlackfeetBolivianBrazilianBritishBritish West IndianBulgarianBurmeseCajunCambodianCanadianCape VerdeanCarpatho RusynCelticCentral AmericanCentral American IndianCherokeeCheyenneChickasawChileanChineseChippewaChoctawColombianColvilleComancheCosta RicanCreeCreekCroatianCrowCubanCypriotCzechCzechoslovakianDanishDelawareDominicanDutchDutch West IndianEastern EuropeanEcuadorianEgyptianEnglishEstonianEthiopianEuropeanFijianFilipinoFinnishFrenchFrench American IndianFrench CanadianGermanGerman RussianGhanaianGreekGuamanian/ChamorroGuatemalanGuyaneseHaitianHmongHonduranHopiHoumaHungarianIcelanderIndian (Asian)IndonesianInupiatIranianIraqiIrishIroquoisIsraeliItalianJamaicanJapaneseJordanianKenyanKiowaKoreanLaotianLatvianLebaneseLiberianLithuanianLumbeeLuxembourgerMacedonianMalaysianMalteseMarshalleseMenomineeMexicanMexican American IndianMongolianMoroccanNative HawaiianNavajoNepaleseNew ZealanderNicaraguanNigerianNorthern EuropeanNorwegianOkinawanOsageOttawaPaiutePakistaniPalestinianPanamanianParaguayanPennsylvania GermanPeruvianPimaPolishPortuguesePotawatomiPuebloPuerto RicanPuget Sound SalishRomanianRussianSalvadoranSamoanScandinavianScotch-IrishScottishSeminoleSenegaleseSerbianShoshoneSierra LeoneanSiouxSlavicSlovakSloveneSomaliSouth AfricanSouth AmericanSouth American IndianSpaniardSpanishSpanish AmericanSpanish American IndianSri LankanSubsaharan AfricanSudaneseSwedishSwissSyrianTaiwaneseThaiTlingit-HaidaTohono O'OdhamTonganTrinidadian and TobagonianTsimshianTurkishU.S. Virgin IslanderUgandanUkrainianUruguayanUteVenezuelanVietnameseWelshWest IndianYakamaYaquiYugoslavianYumanYup'ikZimbabwean
Immigration
NonimmigrantsImmigrantsAfghanistanAfricaAlbaniaArgentinaArmeniaAsiaAustraliaAustriaBahamasBangladeshBarbadosBelarusBelgiumBelizeBoliviaBosnia and HerzegovinaBrazilBulgariaBurma/MyanmarCabo VerdeCambodiaCameroonCanadaCaribbeanCentral AmericaChileChinaColombiaCongoCosta RicaCroatiaCubaCzechoslovakiaDenmarkDominicaDominican RepublicEastern AfricaEastern AsiaEastern EuropeEcuadorEgyptEl SalvadorEnglandEritreaEthiopiaEuropeFijiFranceGermanyGhanaGreeceGrenadaGuatemalaGuyanaHaitiHondurasHong KongHungaryIndiaIndonesiaIranIraqIrelandIsraelItalyJamaicaJapanJordanKazakhstanKenyaKoreaKuwaitLaosLatin AmericaLatviaLebanonLiberiaLithuaniaMalaysiaMexicoMicronesiaMiddle AfricaMoldovaMoroccoNepalNetherlandsNicaraguaNigeriaNorth AmericaNorth MacedoniaNorthern AfricaNorthern EuropeNorwayOceaniaPakistanPanamaPeruPhilippinesPolandPortugalRomaniaRussiaSaudi ArabiaScotlandSenegalSerbiaSierra LeoneSingaporeSomaliaSouth AfricaSouth AmericaSouth Central AsiaSouth Eastern AsiaSouthern EuropeSpainSri LankaSt. Vincent and the GrenadinesSudanSwedenSwitzerlandSyriaTaiwanThailandTrinidad and TobagoTurkeyUgandaUkraineUruguayUzbekistanVenezuelaVietnamWest IndiesWestern AfricaWestern AsiaWestern EuropeYemenZaireZimbabweAzores
Unemployment Among Ages 30 to 34 years
Income
Poverty
Unemployment
Labor Participation
Family Structure
Vehicle Availability
Education Level
Disability

Unemployment Among Ages 30 to 34 years Comparison

Soviet Union

French Canadians

Exceptional
Tragic
5.0%
UNEMPLOYMENT AMONG AGES 30 TO 34 YEARS
98.8/ 100
METRIC RATING
43rd/ 347
METRIC RANK
5.8%
UNEMPLOYMENT AMONG AGES 30 TO 34 YEARS
4.4/ 100
METRIC RATING
219th/ 347
METRIC RANK

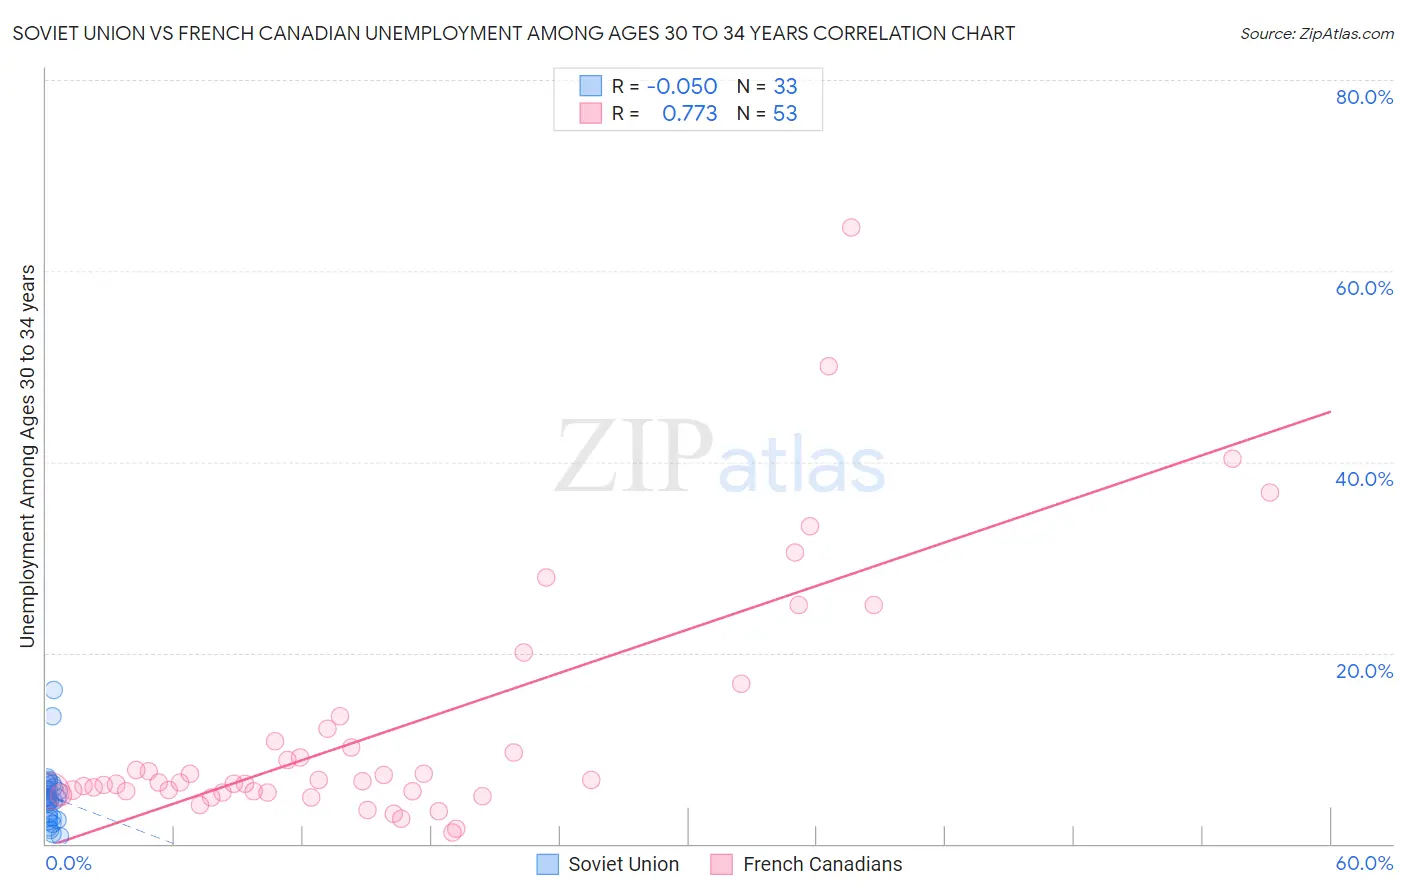
Soviet Union vs French Canadian Unemployment Among Ages 30 to 34 years Correlation Chart

The statistical analysis conducted on geographies consisting of 43,078,343 people shows a slight negative correlation between the proportion of Soviet Union and unemployment rate among population between the ages 30 and 34 in the United States with a correlation coefficient (R) of -0.050 and weighted average of 5.0%. Similarly, the statistical analysis conducted on geographies consisting of 452,515,784 people shows a strong positive correlation between the proportion of French Canadians and unemployment rate among population between the ages 30 and 34 in the United States with a correlation coefficient (R) of 0.773 and weighted average of 5.8%, a difference of 14.0%.
Soviet Union vs French Canadian Unemployment Among Ages 30 to 34 years

Unemployment Among Ages 30 to 34 years Correlation Summary

MeasurementSoviet UnionFrench Canadian
Minimum0.80%1.2%
Maximum16.1%64.5%
Range15.3%63.3%
Mean4.9%12.0%
Median4.8%6.4%
Interquartile 25% (IQ1)2.7%5.5%
Interquartile 75% (IQ3)6.1%11.4%
Interquartile Range (IQR)3.4%5.9%
Standard Deviation (Sample)3.1%12.9%
Standard Deviation (Population)3.0%12.8%

Similar Demographics by Unemployment Among Ages 30 to 34 years

Demographics Similar to Soviet Union by Unemployment Among Ages 30 to 34 years

In terms of unemployment among ages 30 to 34 years, the demographic groups most similar to Soviet Union are Immigrants from Hong Kong (5.0%, a difference of 0.10%), Immigrants from Belgium (5.1%, a difference of 0.14%), Yugoslavian (5.1%, a difference of 0.17%), Immigrants from Vietnam (5.0%, a difference of 0.28%), and Immigrants from Eastern Africa (5.0%, a difference of 0.28%).
DemographicsRating | RankUnemployment Among Ages 30 to 34 years
Czechs
99.2
/100
|
#36
Exceptional
5.0%
Immigrants | Turkey
99.0
/100
|
#37
Exceptional
5.0%
Sri Lankans
99.0
/100
|
#38
Exceptional
5.0%
Fijians
99.0
/100
|
#39
Exceptional
5.0%
Immigrants | Vietnam
98.9
/100
|
#40
Exceptional
5.0%
Immigrants | Eastern Africa
98.9
/100
|
#41
Exceptional
5.0%
Immigrants | Hong Kong
98.8
/100
|
#42
Exceptional
5.0%
Soviet Union
98.8
/100
|
#43
Exceptional
5.0%
Immigrants | Belgium
98.7
/100
|
#44
Exceptional
5.1%
Yugoslavians
98.6
/100
|
#45
Exceptional
5.1%
Immigrants | Congo
98.4
/100
|
#46
Exceptional
5.1%
Cypriots
98.4
/100
|
#47
Exceptional
5.1%
Assyrians/Chaldeans/Syriacs
98.4
/100
|
#48
Exceptional
5.1%
Immigrants | Malaysia
98.3
/100
|
#49
Exceptional
5.1%
Puget Sound Salish
98.2
/100
|
#50
Exceptional
5.1%

Demographics Similar to French Canadians by Unemployment Among Ages 30 to 34 years

In terms of unemployment among ages 30 to 34 years, the demographic groups most similar to French Canadians are Panamanian (5.8%, a difference of 0.030%), Sierra Leonean (5.8%, a difference of 0.21%), Guamanian/Chamorro (5.8%, a difference of 0.23%), Immigrants from Fiji (5.7%, a difference of 0.24%), and Immigrants from Syria (5.7%, a difference of 0.38%).
DemographicsRating | RankUnemployment Among Ages 30 to 34 years
Scotch-Irish
8.6
/100
|
#212
Tragic
5.7%
Immigrants | Immigrants
7.1
/100
|
#213
Tragic
5.7%
Immigrants | Panama
5.9
/100
|
#214
Tragic
5.7%
Immigrants | Cambodia
5.8
/100
|
#215
Tragic
5.7%
Immigrants | Syria
5.5
/100
|
#216
Tragic
5.7%
Immigrants | Fiji
5.1
/100
|
#217
Tragic
5.7%
Panamanians
4.5
/100
|
#218
Tragic
5.8%
French Canadians
4.4
/100
|
#219
Tragic
5.8%
Sierra Leoneans
3.9
/100
|
#220
Tragic
5.8%
Guamanians/Chamorros
3.9
/100
|
#221
Tragic
5.8%
Spaniards
3.2
/100
|
#222
Tragic
5.8%
Bermudans
2.7
/100
|
#223
Tragic
5.8%
Slovaks
2.5
/100
|
#224
Tragic
5.8%
Samoans
2.5
/100
|
#225
Tragic
5.8%
Liberians
2.3
/100
|
#226
Tragic
5.8%