South American Indian vs Lebanese Unemployment Among Ages 20 to 24 years

COMPARE

South American Indian
Race
Ancestry
AfghanAfricanAlaska NativeAlaskan AthabascanAlbanianAleutAlsatianAmericanApacheArabArapahoArgentineanArmenianAssyrian/Chaldean/SyriacAustralianAustrianBahamianBangladeshiBarbadianBasqueBelgianBelizeanBermudanBhutaneseBlackfeetBolivianBrazilianBritishBritish West IndianBulgarianBurmeseCajunCambodianCanadianCape VerdeanCarpatho RusynCelticCentral AmericanCentral American IndianCherokeeCheyenneChickasawChileanChineseChippewaChoctawColombianColvilleComancheCosta RicanCreeCreekCroatianCrowCubanCypriotCzechCzechoslovakianDanishDelawareDominicanDutchDutch West IndianEastern EuropeanEcuadorianEgyptianEnglishEstonianEthiopianEuropeanFijianFilipinoFinnishFrenchFrench American IndianFrench CanadianGermanGerman RussianGhanaianGreekGuamanian/ChamorroGuatemalanGuyaneseHaitianHmongHonduranHopiHoumaHungarianIcelanderIndian (Asian)IndonesianInupiatIranianIraqiIrishIroquoisIsraeliItalianJamaicanJapaneseJordanianKenyanKiowaKoreanLaotianLatvianLiberianLithuanianLumbeeLuxembourgerMacedonianMalaysianMalteseMarshalleseMenomineeMexicanMexican American IndianMongolianMoroccanNative HawaiianNavajoNepaleseNew ZealanderNicaraguanNigerianNorthern EuropeanNorwegianOkinawanOsageOttawaPaiutePakistaniPalestinianPanamanianParaguayanPennsylvania GermanPeruvianPimaPolishPortuguesePotawatomiPuebloPuerto RicanPuget Sound SalishRomanianRussianSalvadoranSamoanScandinavianScotch-IrishScottishSeminoleSenegaleseSerbianShoshoneSierra LeoneanSiouxSlavicSlovakSloveneSomaliSouth AfricanSouth AmericanSouth American IndianSoviet UnionSpaniardSpanishSpanish AmericanSpanish American IndianSri LankanSubsaharan AfricanSudaneseSwedishSwissSyrianTaiwaneseThaiTlingit-HaidaTohono O'OdhamTonganTrinidadian and TobagonianTsimshianTurkishU.S. Virgin IslanderUgandanUkrainianUruguayanUteVenezuelanVietnameseWelshWest IndianYakamaYaquiYugoslavianYumanYup'ikZimbabwean
Immigration
NonimmigrantsImmigrantsAfghanistanAfricaAlbaniaArgentinaArmeniaAsiaAustraliaAustriaBahamasBangladeshBarbadosBelarusBelgiumBelizeBoliviaBosnia and HerzegovinaBrazilBulgariaBurma/MyanmarCabo VerdeCambodiaCameroonCanadaCaribbeanCentral AmericaChileChinaColombiaCongoCosta RicaCroatiaCubaCzechoslovakiaDenmarkDominicaDominican RepublicEastern AfricaEastern AsiaEastern EuropeEcuadorEgyptEl SalvadorEnglandEritreaEthiopiaEuropeFijiFranceGermanyGhanaGreeceGrenadaGuatemalaGuyanaHaitiHondurasHong KongHungaryIndiaIndonesiaIranIraqIrelandIsraelItalyJamaicaJapanJordanKazakhstanKenyaKoreaKuwaitLaosLatin AmericaLatviaLebanonLiberiaLithuaniaMalaysiaMexicoMicronesiaMiddle AfricaMoldovaMoroccoNepalNetherlandsNicaraguaNigeriaNorth AmericaNorth MacedoniaNorthern AfricaNorthern EuropeNorwayOceaniaPakistanPanamaPeruPhilippinesPolandPortugalRomaniaRussiaSaudi ArabiaScotlandSenegalSerbiaSierra LeoneSingaporeSomaliaSouth AfricaSouth AmericaSouth Central AsiaSouth Eastern AsiaSouthern EuropeSpainSri LankaSt. Vincent and the GrenadinesSudanSwedenSwitzerlandSyriaTaiwanThailandTrinidad and TobagoTurkeyUgandaUkraineUruguayUzbekistanVenezuelaVietnamWest IndiesWestern AfricaWestern AsiaWestern EuropeYemenZaireZimbabweAzores
Lebanese
Race
Ancestry
AfghanAfricanAlaska NativeAlaskan AthabascanAlbanianAleutAlsatianAmericanApacheArabArapahoArgentineanArmenianAssyrian/Chaldean/SyriacAustralianAustrianBahamianBangladeshiBarbadianBasqueBelgianBelizeanBermudanBhutaneseBlackfeetBolivianBrazilianBritishBritish West IndianBulgarianBurmeseCajunCambodianCanadianCape VerdeanCarpatho RusynCelticCentral AmericanCentral American IndianCherokeeCheyenneChickasawChileanChineseChippewaChoctawColombianColvilleComancheCosta RicanCreeCreekCroatianCrowCubanCypriotCzechCzechoslovakianDanishDelawareDominicanDutchDutch West IndianEastern EuropeanEcuadorianEgyptianEnglishEstonianEthiopianEuropeanFijianFilipinoFinnishFrenchFrench American IndianFrench CanadianGermanGerman RussianGhanaianGreekGuamanian/ChamorroGuatemalanGuyaneseHaitianHmongHonduranHopiHoumaHungarianIcelanderIndian (Asian)IndonesianInupiatIranianIraqiIrishIroquoisIsraeliItalianJamaicanJapaneseJordanianKenyanKiowaKoreanLaotianLatvianLebaneseLiberianLithuanianLumbeeLuxembourgerMacedonianMalaysianMalteseMarshalleseMenomineeMexicanMexican American IndianMongolianMoroccanNative HawaiianNavajoNepaleseNew ZealanderNicaraguanNigerianNorthern EuropeanNorwegianOkinawanOsageOttawaPaiutePakistaniPalestinianPanamanianParaguayanPennsylvania GermanPeruvianPimaPolishPortuguesePotawatomiPuebloPuerto RicanPuget Sound SalishRomanianRussianSalvadoranSamoanScandinavianScotch-IrishScottishSeminoleSenegaleseSerbianShoshoneSierra LeoneanSiouxSlavicSlovakSloveneSomaliSouth AfricanSouth AmericanSoviet UnionSpaniardSpanishSpanish AmericanSpanish American IndianSri LankanSubsaharan AfricanSudaneseSwedishSwissSyrianTaiwaneseThaiTlingit-HaidaTohono O'OdhamTonganTrinidadian and TobagonianTsimshianTurkishU.S. Virgin IslanderUgandanUkrainianUruguayanUteVenezuelanVietnameseWelshWest IndianYakamaYaquiYugoslavianYumanYup'ikZimbabwean
Immigration
NonimmigrantsImmigrantsAfghanistanAfricaAlbaniaArgentinaArmeniaAsiaAustraliaAustriaBahamasBangladeshBarbadosBelarusBelgiumBelizeBoliviaBosnia and HerzegovinaBrazilBulgariaBurma/MyanmarCabo VerdeCambodiaCameroonCanadaCaribbeanCentral AmericaChileChinaColombiaCongoCosta RicaCroatiaCubaCzechoslovakiaDenmarkDominicaDominican RepublicEastern AfricaEastern AsiaEastern EuropeEcuadorEgyptEl SalvadorEnglandEritreaEthiopiaEuropeFijiFranceGermanyGhanaGreeceGrenadaGuatemalaGuyanaHaitiHondurasHong KongHungaryIndiaIndonesiaIranIraqIrelandIsraelItalyJamaicaJapanJordanKazakhstanKenyaKoreaKuwaitLaosLatin AmericaLatviaLebanonLiberiaLithuaniaMalaysiaMexicoMicronesiaMiddle AfricaMoldovaMoroccoNepalNetherlandsNicaraguaNigeriaNorth AmericaNorth MacedoniaNorthern AfricaNorthern EuropeNorwayOceaniaPakistanPanamaPeruPhilippinesPolandPortugalRomaniaRussiaSaudi ArabiaScotlandSenegalSerbiaSierra LeoneSingaporeSomaliaSouth AfricaSouth AmericaSouth Central AsiaSouth Eastern AsiaSouthern EuropeSpainSri LankaSt. Vincent and the GrenadinesSudanSwedenSwitzerlandSyriaTaiwanThailandTrinidad and TobagoTurkeyUgandaUkraineUruguayUzbekistanVenezuelaVietnamWest IndiesWestern AfricaWestern AsiaWestern EuropeYemenZaireZimbabweAzores
Unemployment Among Ages 20 to 24 years
Income
Poverty
Unemployment
Labor Participation
Family Structure
Vehicle Availability
Education Level
Disability

Unemployment Among Ages 20 to 24 years Comparison

South American Indians

Lebanese

Tragic
Average
10.8%
UNEMPLOYMENT AMONG AGES 20 TO 24 YEARS
0.5/ 100
METRIC RATING
249th/ 347
METRIC RANK
10.3%
UNEMPLOYMENT AMONG AGES 20 TO 24 YEARS
58.3/ 100
METRIC RATING
165th/ 347
METRIC RANK

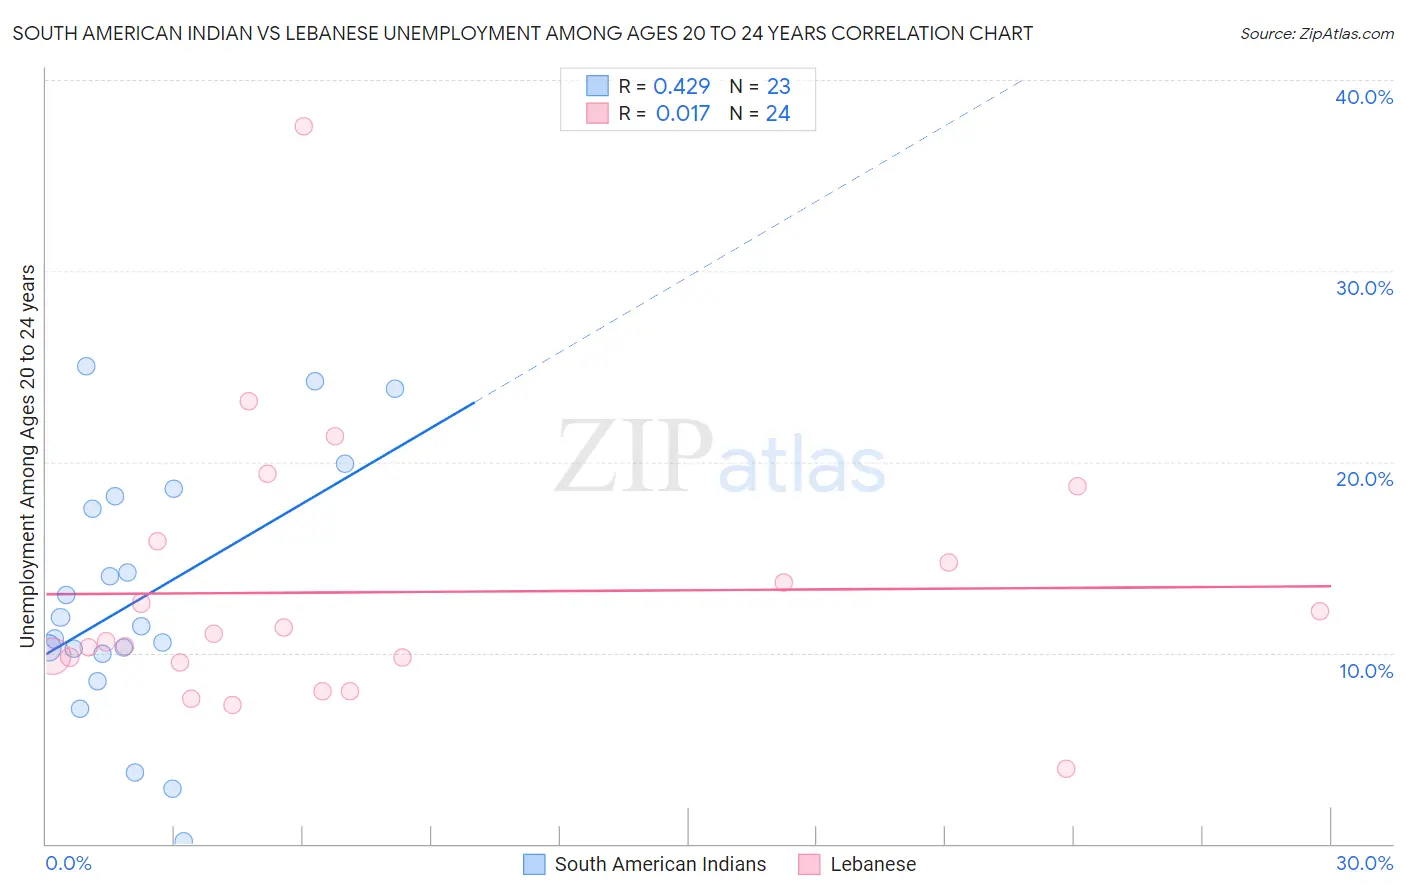
South American Indian vs Lebanese Unemployment Among Ages 20 to 24 years Correlation Chart

The statistical analysis conducted on geographies consisting of 163,103,975 people shows a moderate positive correlation between the proportion of South American Indians and unemployment rate among population between the ages 20 and 24 in the United States with a correlation coefficient (R) of 0.429 and weighted average of 10.8%. Similarly, the statistical analysis conducted on geographies consisting of 388,262,435 people shows no correlation between the proportion of Lebanese and unemployment rate among population between the ages 20 and 24 in the United States with a correlation coefficient (R) of 0.017 and weighted average of 10.3%, a difference of 5.2%.
South American Indian vs Lebanese Unemployment Among Ages 20 to 24 years

Unemployment Among Ages 20 to 24 years Correlation Summary

MeasurementSouth American IndianLebanese
Minimum0.10%3.9%
Maximum25.0%37.6%
Range24.9%33.7%
Mean12.9%13.2%
Median11.4%10.8%
Interquartile 25% (IQ1)9.9%9.6%
Interquartile 75% (IQ3)18.2%15.3%
Interquartile Range (IQR)8.3%5.6%
Standard Deviation (Sample)6.6%7.0%
Standard Deviation (Population)6.5%6.9%

Similar Demographics by Unemployment Among Ages 20 to 24 years

Demographics Similar to South American Indians by Unemployment Among Ages 20 to 24 years

In terms of unemployment among ages 20 to 24 years, the demographic groups most similar to South American Indians are Albanian (10.8%, a difference of 0.040%), Immigrants from Panama (10.8%, a difference of 0.10%), Immigrants from Syria (10.8%, a difference of 0.17%), Cree (10.8%, a difference of 0.20%), and Spanish American (10.8%, a difference of 0.22%).
DemographicsRating | RankUnemployment Among Ages 20 to 24 years
Moroccans
1.4
/100
|
#242
Tragic
10.7%
Immigrants | Belarus
1.3
/100
|
#243
Tragic
10.7%
Immigrants | Mexico
1.2
/100
|
#244
Tragic
10.7%
Hispanics or Latinos
1.0
/100
|
#245
Tragic
10.7%
Immigrants | Iran
0.9
/100
|
#246
Tragic
10.8%
Immigrants | Albania
0.7
/100
|
#247
Tragic
10.8%
Cree
0.6
/100
|
#248
Tragic
10.8%
South American Indians
0.5
/100
|
#249
Tragic
10.8%
Albanians
0.5
/100
|
#250
Tragic
10.8%
Immigrants | Panama
0.4
/100
|
#251
Tragic
10.8%
Immigrants | Syria
0.4
/100
|
#252
Tragic
10.8%
Spanish Americans
0.4
/100
|
#253
Tragic
10.8%
Liberians
0.3
/100
|
#254
Tragic
10.8%
Immigrants | Israel
0.3
/100
|
#255
Tragic
10.8%
Immigrants | Bahamas
0.3
/100
|
#256
Tragic
10.9%

Demographics Similar to Lebanese by Unemployment Among Ages 20 to 24 years

In terms of unemployment among ages 20 to 24 years, the demographic groups most similar to Lebanese are Italian (10.3%, a difference of 0.020%), Immigrants from Fiji (10.3%, a difference of 0.020%), Immigrants from Korea (10.3%, a difference of 0.030%), Iraqi (10.3%, a difference of 0.060%), and Immigrants from Colombia (10.3%, a difference of 0.070%).
DemographicsRating | RankUnemployment Among Ages 20 to 24 years
Immigrants | Kazakhstan
65.5
/100
|
#158
Good
10.2%
Immigrants | England
63.7
/100
|
#159
Good
10.3%
Spaniards
63.4
/100
|
#160
Good
10.3%
Indians (Asian)
62.6
/100
|
#161
Good
10.3%
Immigrants | Asia
61.3
/100
|
#162
Good
10.3%
Estonians
61.1
/100
|
#163
Good
10.3%
Immigrants | Korea
59.0
/100
|
#164
Average
10.3%
Lebanese
58.3
/100
|
#165
Average
10.3%
Italians
57.7
/100
|
#166
Average
10.3%
Immigrants | Fiji
57.6
/100
|
#167
Average
10.3%
Iraqis
56.7
/100
|
#168
Average
10.3%
Immigrants | Colombia
56.3
/100
|
#169
Average
10.3%
Turks
55.2
/100
|
#170
Average
10.3%
Immigrants | Eastern Asia
52.7
/100
|
#171
Average
10.3%
Koreans
51.9
/100
|
#172
Average
10.3%