South American Indian vs Immigrants from Brazil Unemployment Among Ages 65 to 74 years
COMPARE
South American Indian
Immigrants from Brazil
Unemployment Among Ages 65 to 74 years
Unemployment Among Ages 65 to 74 years Comparison
South American Indians
Immigrants from Brazil
5.5%
UNEMPLOYMENT AMONG AGES 65 TO 74 YEARS
2.3/ 100
METRIC RATING
233rd/ 347
METRIC RANK
5.6%
UNEMPLOYMENT AMONG AGES 65 TO 74 YEARS
0.5/ 100
METRIC RATING
253rd/ 347
METRIC RANK
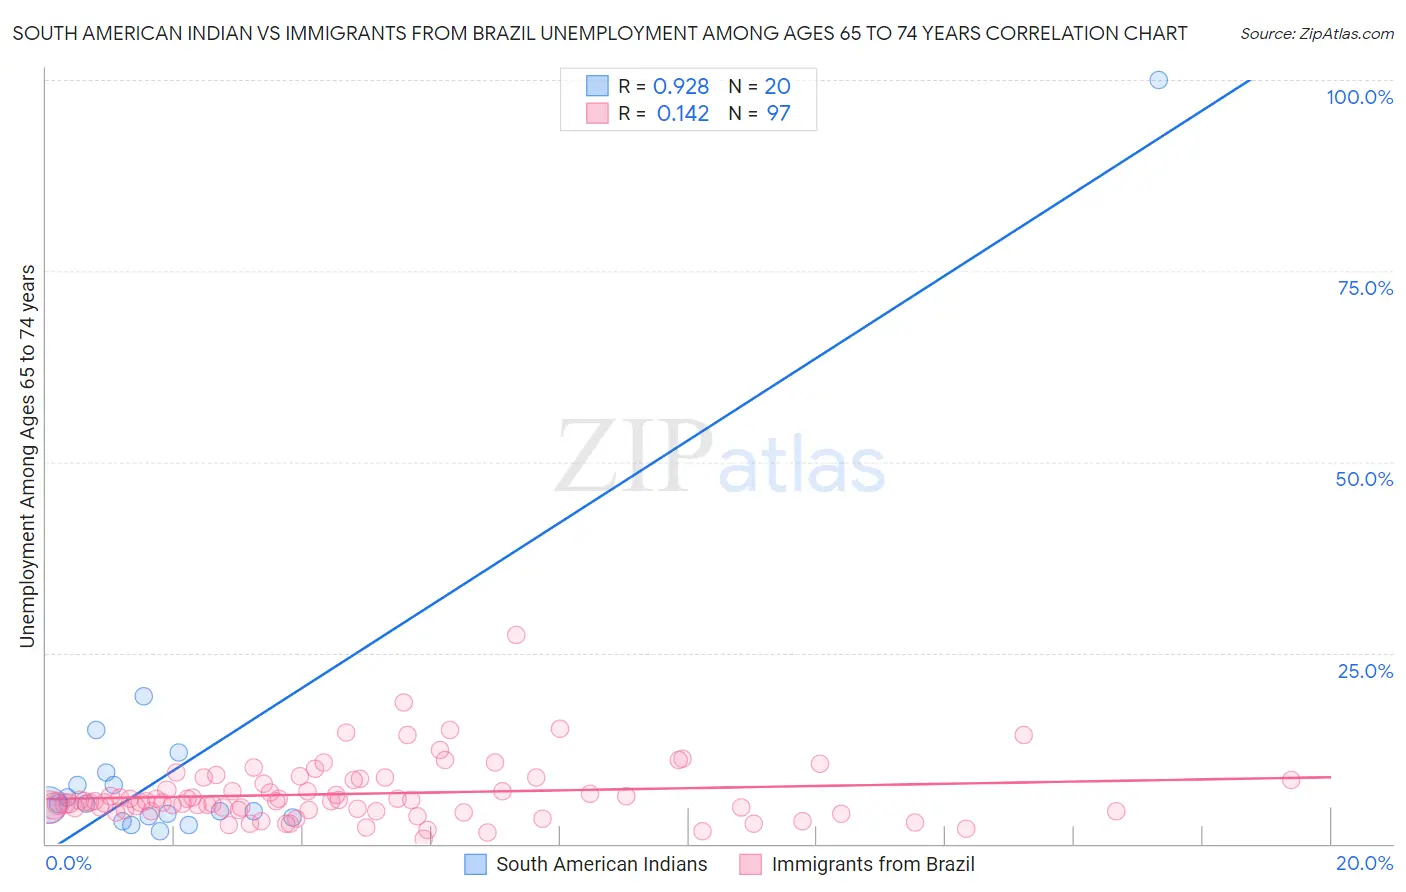
South American Indian vs Immigrants from Brazil Unemployment Among Ages 65 to 74 years Correlation Chart
The statistical analysis conducted on geographies consisting of 156,397,122 people shows a near-perfect positive correlation between the proportion of South American Indians and unemployment rate among population between the ages 65 and 74 in the United States with a correlation coefficient (R) of 0.928 and weighted average of 5.5%. Similarly, the statistical analysis conducted on geographies consisting of 309,749,497 people shows a poor positive correlation between the proportion of Immigrants from Brazil and unemployment rate among population between the ages 65 and 74 in the United States with a correlation coefficient (R) of 0.142 and weighted average of 5.6%, a difference of 1.3%.
Unemployment Among Ages 65 to 74 years Correlation Summary
| Measurement | South American Indian | Immigrants from Brazil |
| Minimum | 1.6% | 0.70% |
| Maximum | 100.0% | 27.4% |
| Range | 98.4% | 26.7% |
| Mean | 11.1% | 6.5% |
| Median | 5.2% | 5.6% |
| Interquartile 25% (IQ1) | 3.5% | 4.4% |
| Interquartile 75% (IQ3) | 8.6% | 8.4% |
| Interquartile Range (IQR) | 5.0% | 4.0% |
| Standard Deviation (Sample) | 21.4% | 4.0% |
| Standard Deviation (Population) | 20.9% | 3.9% |
Demographics Similar to South American Indians and Immigrants from Brazil by Unemployment Among Ages 65 to 74 years
In terms of unemployment among ages 65 to 74 years, the demographic groups most similar to South American Indians are French American Indian (5.5%, a difference of 0.020%), Peruvian (5.5%, a difference of 0.020%), Hopi (5.5%, a difference of 0.030%), Immigrants from Belize (5.5%, a difference of 0.030%), and Cajun (5.5%, a difference of 0.19%). Similarly, the demographic groups most similar to Immigrants from Brazil are Colombian (5.6%, a difference of 0.060%), Brazilian (5.6%, a difference of 0.10%), Cape Verdean (5.6%, a difference of 0.35%), Trinidadian and Tobagonian (5.6%, a difference of 0.43%), and Immigrants from Argentina (5.6%, a difference of 0.49%).
| Demographics | Rating | Rank | Unemployment Among Ages 65 to 74 years |
| South American Indians | 2.3 /100 | #233 | Tragic 5.5% |
| French American Indians | 2.2 /100 | #234 | Tragic 5.5% |
| Peruvians | 2.2 /100 | #235 | Tragic 5.5% |
| Hopi | 2.2 /100 | #236 | Tragic 5.5% |
| Immigrants | Belize | 2.2 /100 | #237 | Tragic 5.5% |
| Cajuns | 1.8 /100 | #238 | Tragic 5.5% |
| German Russians | 1.6 /100 | #239 | Tragic 5.5% |
| Ghanaians | 1.4 /100 | #240 | Tragic 5.6% |
| Cree | 1.4 /100 | #241 | Tragic 5.6% |
| Immigrants | Ghana | 1.4 /100 | #242 | Tragic 5.6% |
| Immigrants | Peru | 1.3 /100 | #243 | Tragic 5.6% |
| Immigrants | Micronesia | 0.9 /100 | #244 | Tragic 5.6% |
| Immigrants | Greece | 0.9 /100 | #245 | Tragic 5.6% |
| Paraguayans | 0.9 /100 | #246 | Tragic 5.6% |
| Immigrants | Immigrants | 0.9 /100 | #247 | Tragic 5.6% |
| Immigrants | Argentina | 0.9 /100 | #248 | Tragic 5.6% |
| Trinidadians and Tobagonians | 0.8 /100 | #249 | Tragic 5.6% |
| Cape Verdeans | 0.7 /100 | #250 | Tragic 5.6% |
| Brazilians | 0.5 /100 | #251 | Tragic 5.6% |
| Colombians | 0.5 /100 | #252 | Tragic 5.6% |
| Immigrants | Brazil | 0.5 /100 | #253 | Tragic 5.6% |