Somali vs Seminole Unemployment Among Ages 25 to 29 years

COMPARE

Somali
Race
Ancestry
AfghanAfricanAlaska NativeAlaskan AthabascanAlbanianAleutAlsatianAmericanApacheArabArapahoArgentineanArmenianAssyrian/Chaldean/SyriacAustralianAustrianBahamianBangladeshiBarbadianBasqueBelgianBelizeanBermudanBhutaneseBlackfeetBolivianBrazilianBritishBritish West IndianBulgarianBurmeseCajunCambodianCanadianCape VerdeanCarpatho RusynCelticCentral AmericanCentral American IndianCherokeeCheyenneChickasawChileanChineseChippewaChoctawColombianColvilleComancheCosta RicanCreeCreekCroatianCrowCubanCypriotCzechCzechoslovakianDanishDelawareDominicanDutchDutch West IndianEastern EuropeanEcuadorianEgyptianEnglishEstonianEthiopianEuropeanFijianFilipinoFinnishFrenchFrench American IndianFrench CanadianGermanGerman RussianGhanaianGreekGuamanian/ChamorroGuatemalanGuyaneseHaitianHmongHonduranHopiHoumaHungarianIcelanderIndian (Asian)IndonesianInupiatIranianIraqiIrishIroquoisIsraeliItalianJamaicanJapaneseJordanianKenyanKiowaKoreanLaotianLatvianLebaneseLiberianLithuanianLumbeeLuxembourgerMacedonianMalaysianMalteseMarshalleseMenomineeMexicanMexican American IndianMongolianMoroccanNative HawaiianNavajoNepaleseNew ZealanderNicaraguanNigerianNorthern EuropeanNorwegianOkinawanOsageOttawaPaiutePakistaniPalestinianPanamanianParaguayanPennsylvania GermanPeruvianPimaPolishPortuguesePotawatomiPuebloPuerto RicanPuget Sound SalishRomanianRussianSalvadoranSamoanScandinavianScotch-IrishScottishSenegaleseSerbianShoshoneSierra LeoneanSiouxSlavicSlovakSloveneSomaliSouth AfricanSouth AmericanSouth American IndianSoviet UnionSpaniardSpanishSpanish AmericanSpanish American IndianSri LankanSubsaharan AfricanSudaneseSwedishSwissSyrianTaiwaneseThaiTlingit-HaidaTohono O'OdhamTonganTrinidadian and TobagonianTsimshianTurkishU.S. Virgin IslanderUgandanUkrainianUruguayanUteVenezuelanVietnameseWelshWest IndianYakamaYaquiYugoslavianYumanYup'ikZimbabwean
Immigration
NonimmigrantsImmigrantsAfghanistanAfricaAlbaniaArgentinaArmeniaAsiaAustraliaAustriaBahamasBangladeshBarbadosBelarusBelgiumBelizeBoliviaBosnia and HerzegovinaBrazilBulgariaBurma/MyanmarCabo VerdeCambodiaCameroonCanadaCaribbeanCentral AmericaChileChinaColombiaCongoCosta RicaCroatiaCubaCzechoslovakiaDenmarkDominicaDominican RepublicEastern AfricaEastern AsiaEastern EuropeEcuadorEgyptEl SalvadorEnglandEritreaEthiopiaEuropeFijiFranceGermanyGhanaGreeceGrenadaGuatemalaGuyanaHaitiHondurasHong KongHungaryIndiaIndonesiaIranIraqIrelandIsraelItalyJamaicaJapanJordanKazakhstanKenyaKoreaKuwaitLaosLatin AmericaLatviaLebanonLiberiaLithuaniaMalaysiaMexicoMicronesiaMiddle AfricaMoldovaMoroccoNepalNetherlandsNicaraguaNigeriaNorth AmericaNorth MacedoniaNorthern AfricaNorthern EuropeNorwayOceaniaPakistanPanamaPeruPhilippinesPolandPortugalRomaniaRussiaSaudi ArabiaScotlandSenegalSerbiaSierra LeoneSingaporeSomaliaSouth AfricaSouth AmericaSouth Central AsiaSouth Eastern AsiaSouthern EuropeSpainSri LankaSt. Vincent and the GrenadinesSudanSwedenSwitzerlandSyriaTaiwanThailandTrinidad and TobagoTurkeyUgandaUkraineUruguayUzbekistanVenezuelaVietnamWest IndiesWestern AfricaWestern AsiaWestern EuropeYemenZaireZimbabweAzores
Seminole
Race
Ancestry
AfghanAfricanAlaska NativeAlaskan AthabascanAlbanianAleutAlsatianAmericanApacheArabArapahoArgentineanArmenianAssyrian/Chaldean/SyriacAustralianAustrianBahamianBangladeshiBarbadianBasqueBelgianBelizeanBermudanBhutaneseBlackfeetBolivianBrazilianBritishBritish West IndianBulgarianBurmeseCajunCambodianCanadianCape VerdeanCarpatho RusynCelticCentral AmericanCentral American IndianCherokeeCheyenneChickasawChileanChineseChippewaChoctawColombianColvilleComancheCosta RicanCreeCreekCroatianCrowCubanCypriotCzechCzechoslovakianDanishDelawareDominicanDutchDutch West IndianEastern EuropeanEcuadorianEgyptianEnglishEstonianEthiopianEuropeanFijianFilipinoFinnishFrenchFrench American IndianFrench CanadianGermanGerman RussianGhanaianGreekGuamanian/ChamorroGuatemalanGuyaneseHaitianHmongHonduranHopiHoumaHungarianIcelanderIndian (Asian)IndonesianInupiatIranianIraqiIrishIroquoisIsraeliItalianJamaicanJapaneseJordanianKenyanKiowaKoreanLaotianLatvianLebaneseLiberianLithuanianLumbeeLuxembourgerMacedonianMalaysianMalteseMarshalleseMenomineeMexicanMexican American IndianMongolianMoroccanNative HawaiianNavajoNepaleseNew ZealanderNicaraguanNigerianNorthern EuropeanNorwegianOkinawanOsageOttawaPaiutePakistaniPalestinianPanamanianParaguayanPennsylvania GermanPeruvianPimaPolishPortuguesePotawatomiPuebloPuerto RicanPuget Sound SalishRomanianRussianSalvadoranSamoanScandinavianScotch-IrishScottishSeminoleSenegaleseSerbianShoshoneSierra LeoneanSiouxSlavicSlovakSloveneSouth AfricanSouth AmericanSouth American IndianSoviet UnionSpaniardSpanishSpanish AmericanSpanish American IndianSri LankanSubsaharan AfricanSudaneseSwedishSwissSyrianTaiwaneseThaiTlingit-HaidaTohono O'OdhamTonganTrinidadian and TobagonianTsimshianTurkishU.S. Virgin IslanderUgandanUkrainianUruguayanUteVenezuelanVietnameseWelshWest IndianYakamaYaquiYugoslavianYumanYup'ikZimbabwean
Immigration
NonimmigrantsImmigrantsAfghanistanAfricaAlbaniaArgentinaArmeniaAsiaAustraliaAustriaBahamasBangladeshBarbadosBelarusBelgiumBelizeBoliviaBosnia and HerzegovinaBrazilBulgariaBurma/MyanmarCabo VerdeCambodiaCameroonCanadaCaribbeanCentral AmericaChileChinaColombiaCongoCosta RicaCroatiaCubaCzechoslovakiaDenmarkDominicaDominican RepublicEastern AfricaEastern AsiaEastern EuropeEcuadorEgyptEl SalvadorEnglandEritreaEthiopiaEuropeFijiFranceGermanyGhanaGreeceGrenadaGuatemalaGuyanaHaitiHondurasHong KongHungaryIndiaIndonesiaIranIraqIrelandIsraelItalyJamaicaJapanJordanKazakhstanKenyaKoreaKuwaitLaosLatin AmericaLatviaLebanonLiberiaLithuaniaMalaysiaMexicoMicronesiaMiddle AfricaMoldovaMoroccoNepalNetherlandsNicaraguaNigeriaNorth AmericaNorth MacedoniaNorthern AfricaNorthern EuropeNorwayOceaniaPakistanPanamaPeruPhilippinesPolandPortugalRomaniaRussiaSaudi ArabiaScotlandSenegalSerbiaSierra LeoneSingaporeSomaliaSouth AfricaSouth AmericaSouth Central AsiaSouth Eastern AsiaSouthern EuropeSpainSri LankaSt. Vincent and the GrenadinesSudanSwedenSwitzerlandSyriaTaiwanThailandTrinidad and TobagoTurkeyUgandaUkraineUruguayUzbekistanVenezuelaVietnamWest IndiesWestern AfricaWestern AsiaWestern EuropeYemenZaireZimbabweAzores
Unemployment Among Ages 25 to 29 years
Income
Poverty
Unemployment
Labor Participation
Family Structure
Vehicle Availability
Education Level
Disability

Unemployment Among Ages 25 to 29 years Comparison

Somalis

Seminole

Exceptional
Tragic
5.6%
UNEMPLOYMENT AMONG AGES 25 TO 29 YEARS
100.0/ 100
METRIC RATING
5th/ 347
METRIC RANK
7.2%
UNEMPLOYMENT AMONG AGES 25 TO 29 YEARS
0.6/ 100
METRIC RATING
249th/ 347
METRIC RANK

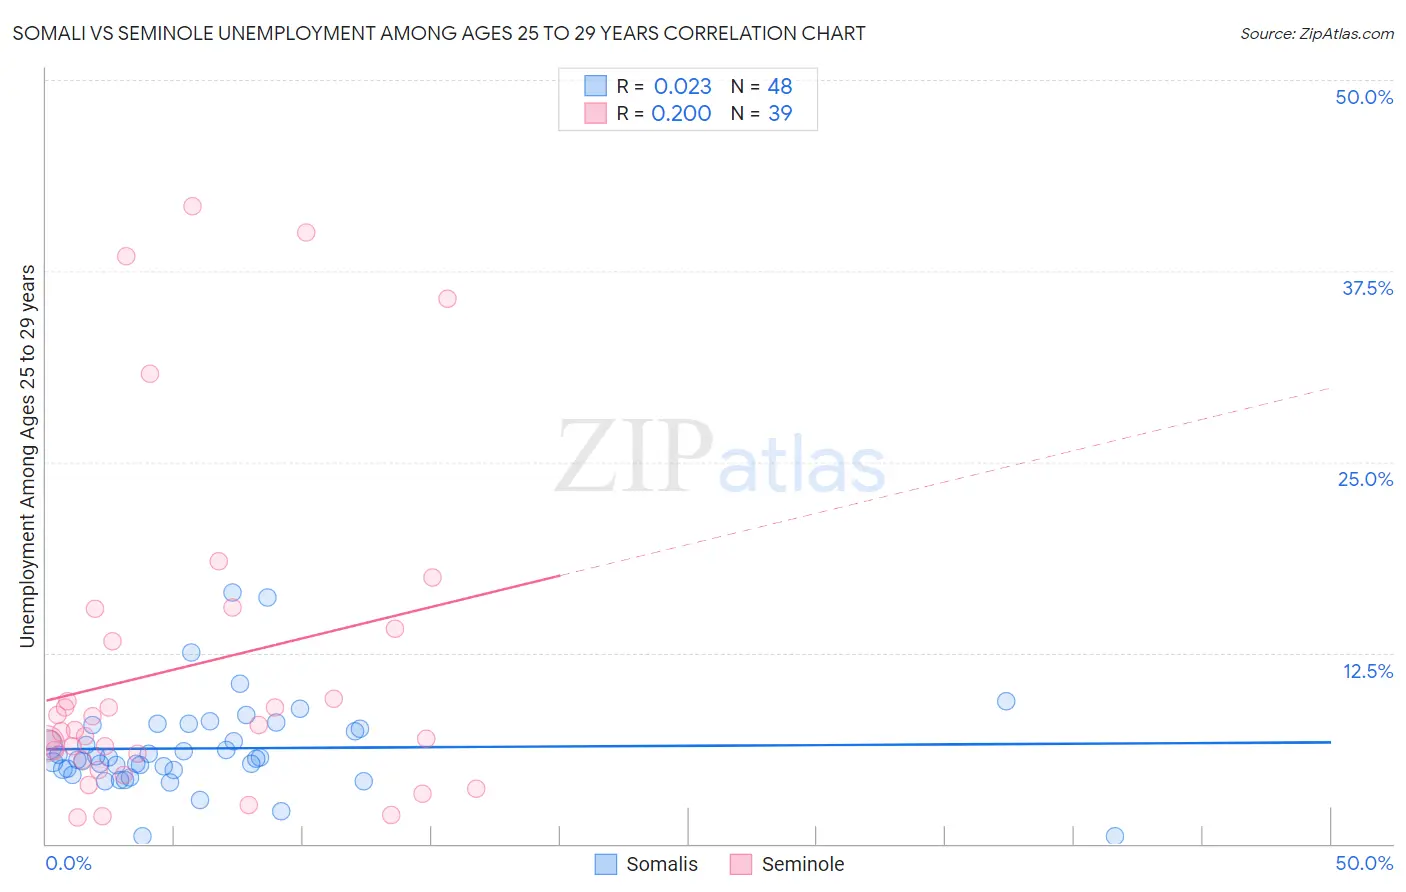
Somali vs Seminole Unemployment Among Ages 25 to 29 years Correlation Chart

The statistical analysis conducted on geographies consisting of 98,062,489 people shows no correlation between the proportion of Somalis and unemployment rate among population between the ages 25 and 29 in the United States with a correlation coefficient (R) of 0.023 and weighted average of 5.6%. Similarly, the statistical analysis conducted on geographies consisting of 115,588,504 people shows a weak positive correlation between the proportion of Seminole and unemployment rate among population between the ages 25 and 29 in the United States with a correlation coefficient (R) of 0.200 and weighted average of 7.2%, a difference of 27.0%.
Somali vs Seminole Unemployment Among Ages 25 to 29 years

Unemployment Among Ages 25 to 29 years Correlation Summary

MeasurementSomaliSeminole
Minimum0.50%1.7%
Maximum16.4%41.7%
Range15.9%40.0%
Mean6.2%11.6%
Median5.6%7.5%
Interquartile 25% (IQ1)4.9%5.5%
Interquartile 75% (IQ3)7.7%14.1%
Interquartile Range (IQR)2.8%8.6%
Standard Deviation (Sample)3.0%10.9%
Standard Deviation (Population)3.0%10.8%

Similar Demographics by Unemployment Among Ages 25 to 29 years

Demographics Similar to Somalis by Unemployment Among Ages 25 to 29 years

In terms of unemployment among ages 25 to 29 years, the demographic groups most similar to Somalis are Immigrants from Cuba (5.6%, a difference of 0.060%), Hmong (5.7%, a difference of 0.19%), Immigrants from India (5.7%, a difference of 0.27%), Immigrants from Bosnia and Herzegovina (5.7%, a difference of 0.39%), and Immigrants from Nepal (5.7%, a difference of 1.7%).
DemographicsRating | RankUnemployment Among Ages 25 to 29 years
Sudanese
100.0
/100
|
#1
Exceptional
5.4%
Tongans
100.0
/100
|
#2
Exceptional
5.5%
Immigrants | Somalia
100.0
/100
|
#3
Exceptional
5.5%
Immigrants | Cuba
100.0
/100
|
#4
Exceptional
5.6%
Somalis
100.0
/100
|
#5
Exceptional
5.6%
Hmong
100.0
/100
|
#6
Exceptional
5.7%
Immigrants | India
100.0
/100
|
#7
Exceptional
5.7%
Immigrants | Bosnia and Herzegovina
100.0
/100
|
#8
Exceptional
5.7%
Immigrants | Nepal
100.0
/100
|
#9
Exceptional
5.7%
Immigrants | Sudan
100.0
/100
|
#10
Exceptional
5.8%
Cambodians
100.0
/100
|
#11
Exceptional
5.8%
Okinawans
100.0
/100
|
#12
Exceptional
5.9%
Immigrants | Bolivia
100.0
/100
|
#13
Exceptional
5.9%
Immigrants | Kuwait
99.9
/100
|
#14
Exceptional
5.9%
Cubans
99.9
/100
|
#15
Exceptional
5.9%

Demographics Similar to Seminole by Unemployment Among Ages 25 to 29 years

In terms of unemployment among ages 25 to 29 years, the demographic groups most similar to Seminole are Subsaharan African (7.2%, a difference of 0.020%), Delaware (7.2%, a difference of 0.16%), Immigrants from Guatemala (7.2%, a difference of 0.19%), Immigrants from Uzbekistan (7.2%, a difference of 0.20%), and Portuguese (7.2%, a difference of 0.22%).
DemographicsRating | RankUnemployment Among Ages 25 to 29 years
Spanish American Indians
1.1
/100
|
#242
Tragic
7.1%
Yaqui
1.0
/100
|
#243
Tragic
7.1%
Immigrants | Nonimmigrants
0.9
/100
|
#244
Tragic
7.1%
Guatemalans
0.9
/100
|
#245
Tragic
7.1%
Immigrants | Uzbekistan
0.7
/100
|
#246
Tragic
7.2%
Immigrants | Guatemala
0.7
/100
|
#247
Tragic
7.2%
Sub-Saharan Africans
0.6
/100
|
#248
Tragic
7.2%
Seminole
0.6
/100
|
#249
Tragic
7.2%
Delaware
0.5
/100
|
#250
Tragic
7.2%
Portuguese
0.5
/100
|
#251
Tragic
7.2%
Sierra Leoneans
0.4
/100
|
#252
Tragic
7.2%
Immigrants | Portugal
0.3
/100
|
#253
Tragic
7.2%
Ghanaians
0.3
/100
|
#254
Tragic
7.2%
Immigrants | Cameroon
0.3
/100
|
#255
Tragic
7.2%
Mexican American Indians
0.3
/100
|
#256
Tragic
7.3%