Somali vs Immigrants from Ukraine Female Unemployment
COMPARE
Somali
Immigrants from Ukraine
Female Unemployment
Female Unemployment Comparison
Somalis
Immigrants from Ukraine
5.0%
FEMALE UNEMPLOYMENT
94.6/ 100
METRIC RATING
103rd/ 347
METRIC RANK
5.3%
FEMALE UNEMPLOYMENT
40.1/ 100
METRIC RATING
184th/ 347
METRIC RANK
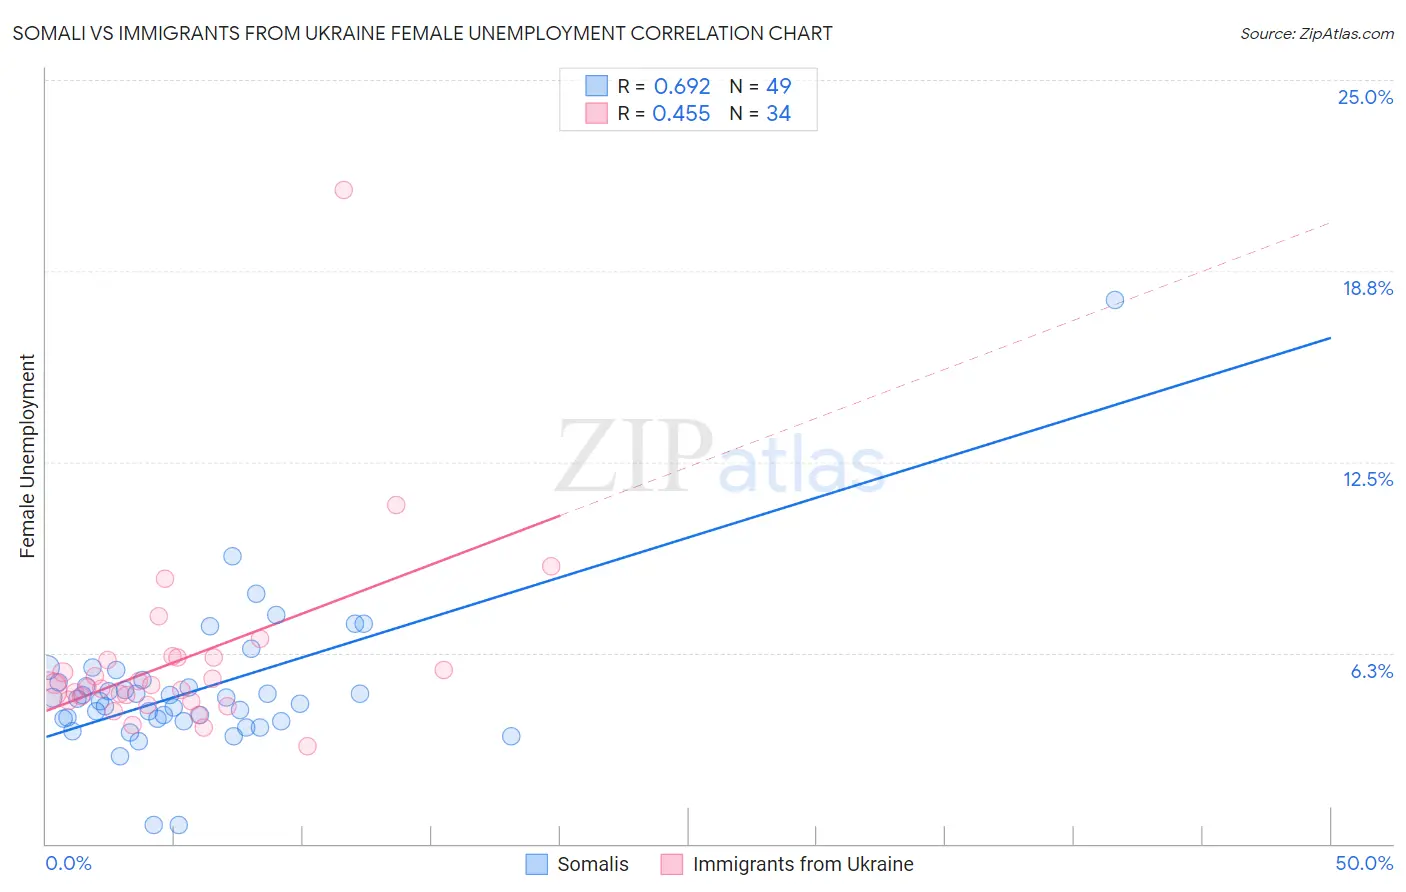
Somali vs Immigrants from Ukraine Female Unemployment Correlation Chart
The statistical analysis conducted on geographies consisting of 99,208,507 people shows a significant positive correlation between the proportion of Somalis and unemploymnet rate among females in the United States with a correlation coefficient (R) of 0.692 and weighted average of 5.0%. Similarly, the statistical analysis conducted on geographies consisting of 288,858,006 people shows a moderate positive correlation between the proportion of Immigrants from Ukraine and unemploymnet rate among females in the United States with a correlation coefficient (R) of 0.455 and weighted average of 5.3%, a difference of 5.1%.
Female Unemployment Correlation Summary
| Measurement | Somali | Immigrants from Ukraine |
| Minimum | 0.60% | 3.2% |
| Maximum | 17.8% | 21.4% |
| Range | 17.2% | 18.2% |
| Mean | 5.0% | 6.0% |
| Median | 4.8% | 5.2% |
| Interquartile 25% (IQ1) | 4.0% | 4.7% |
| Interquartile 75% (IQ3) | 5.3% | 6.1% |
| Interquartile Range (IQR) | 1.3% | 1.4% |
| Standard Deviation (Sample) | 2.4% | 3.1% |
| Standard Deviation (Population) | 2.4% | 3.1% |
Similar Demographics by Female Unemployment
Demographics Similar to Somalis by Female Unemployment
In terms of female unemployment, the demographic groups most similar to Somalis are Immigrants from Kenya (5.0%, a difference of 0.080%), Immigrants from Czechoslovakia (5.0%, a difference of 0.13%), Indonesian (5.0%, a difference of 0.17%), Immigrants from Zaire (5.0%, a difference of 0.19%), and Immigrants from Somalia (5.0%, a difference of 0.20%).
| Demographics | Rating | Rank | Female Unemployment |
| Immigrants | South Central Asia | 95.5 /100 | #96 | Exceptional 5.0% |
| Immigrants | Somalia | 95.2 /100 | #97 | Exceptional 5.0% |
| Immigrants | Kuwait | 95.2 /100 | #98 | Exceptional 5.0% |
| Immigrants | Zaire | 95.2 /100 | #99 | Exceptional 5.0% |
| Indonesians | 95.1 /100 | #100 | Exceptional 5.0% |
| Immigrants | Czechoslovakia | 95.0 /100 | #101 | Exceptional 5.0% |
| Immigrants | Kenya | 94.8 /100 | #102 | Exceptional 5.0% |
| Somalis | 94.6 /100 | #103 | Exceptional 5.0% |
| Kenyans | 93.7 /100 | #104 | Exceptional 5.0% |
| Immigrants | England | 93.6 /100 | #105 | Exceptional 5.0% |
| Paraguayans | 93.2 /100 | #106 | Exceptional 5.1% |
| Immigrants | Switzerland | 93.1 /100 | #107 | Exceptional 5.1% |
| Puget Sound Salish | 93.0 /100 | #108 | Exceptional 5.1% |
| Immigrants | Eastern Africa | 92.8 /100 | #109 | Exceptional 5.1% |
| Macedonians | 92.4 /100 | #110 | Exceptional 5.1% |
Demographics Similar to Immigrants from Ukraine by Female Unemployment
In terms of female unemployment, the demographic groups most similar to Immigrants from Ukraine are Malaysian (5.3%, a difference of 0.010%), Immigrants from Indonesia (5.3%, a difference of 0.030%), Immigrants from Belarus (5.3%, a difference of 0.050%), Nonimmigrants (5.3%, a difference of 0.15%), and Taiwanese (5.3%, a difference of 0.16%).
| Demographics | Rating | Rank | Female Unemployment |
| Immigrants | Morocco | 47.4 /100 | #177 | Average 5.3% |
| Immigrants | Southern Europe | 46.2 /100 | #178 | Average 5.3% |
| Laotians | 45.1 /100 | #179 | Average 5.3% |
| Immigrants | Congo | 43.1 /100 | #180 | Average 5.3% |
| Taiwanese | 42.7 /100 | #181 | Average 5.3% |
| Immigrants | Nonimmigrants | 42.6 /100 | #182 | Average 5.3% |
| Immigrants | Indonesia | 40.7 /100 | #183 | Average 5.3% |
| Immigrants | Ukraine | 40.1 /100 | #184 | Average 5.3% |
| Malaysians | 40.1 /100 | #185 | Average 5.3% |
| Immigrants | Belarus | 39.4 /100 | #186 | Fair 5.3% |
| Immigrants | Albania | 35.4 /100 | #187 | Fair 5.3% |
| Afghans | 33.9 /100 | #188 | Fair 5.3% |
| Costa Ricans | 33.8 /100 | #189 | Fair 5.3% |
| Ugandans | 31.2 /100 | #190 | Fair 5.3% |
| Cherokee | 30.8 /100 | #191 | Fair 5.3% |