Slovene vs Peruvian Unemployment
COMPARE
Slovene
Peruvian
Unemployment
Unemployment Comparison
Slovenes
Peruvians
4.7%
UNEMPLOYMENT
99.9/ 100
METRIC RATING
17th/ 347
METRIC RANK
5.3%
UNEMPLOYMENT
29.9/ 100
METRIC RATING
196th/ 347
METRIC RANK
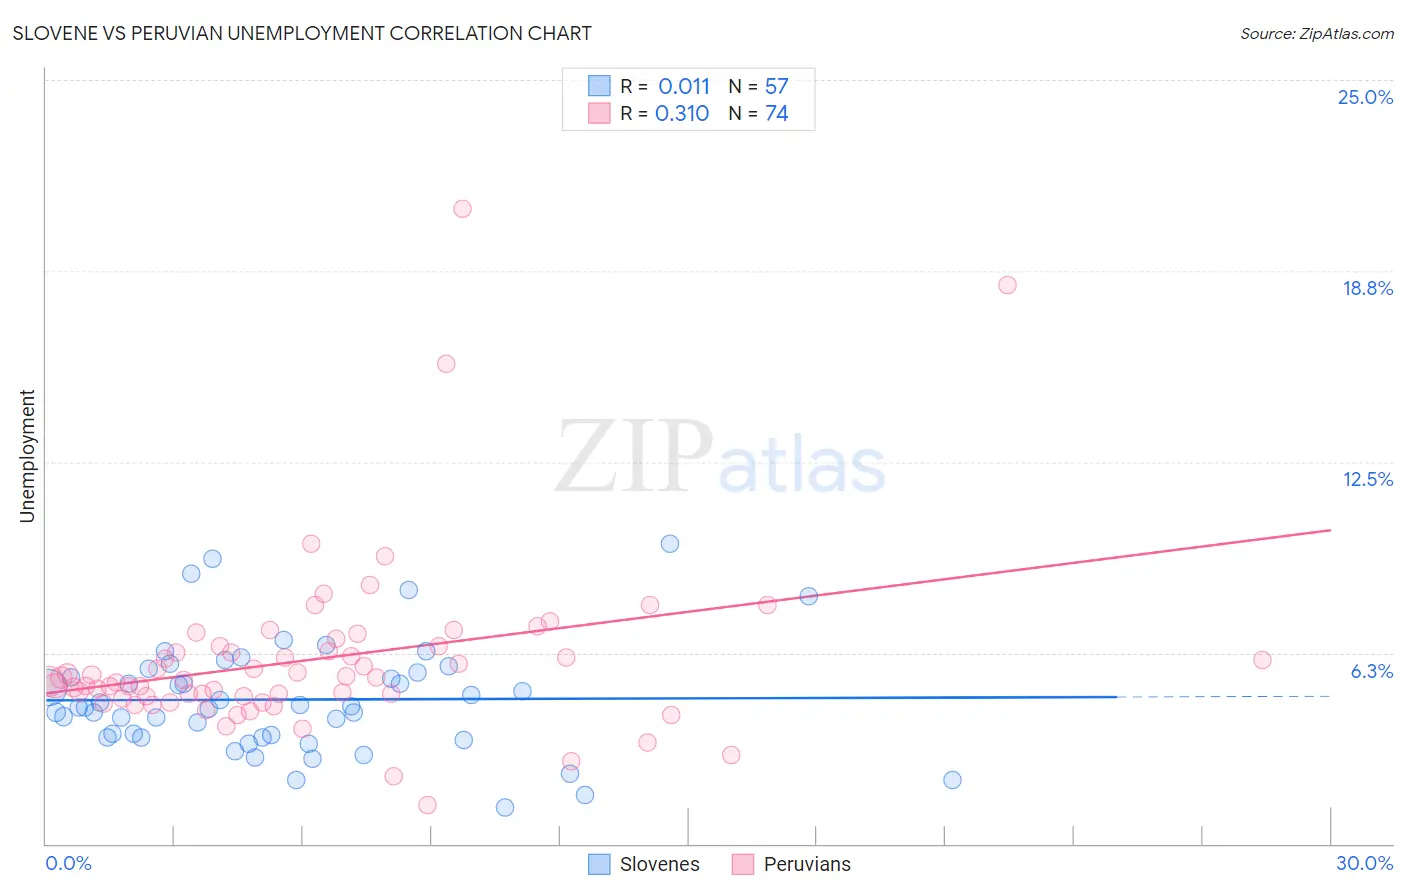
Slovene vs Peruvian Unemployment Correlation Chart
The statistical analysis conducted on geographies consisting of 261,132,264 people shows no correlation between the proportion of Slovenes and unemployment in the United States with a correlation coefficient (R) of 0.011 and weighted average of 4.7%. Similarly, the statistical analysis conducted on geographies consisting of 362,987,684 people shows a mild positive correlation between the proportion of Peruvians and unemployment in the United States with a correlation coefficient (R) of 0.310 and weighted average of 5.3%, a difference of 14.4%.
Unemployment Correlation Summary
| Measurement | Slovene | Peruvian |
| Minimum | 1.2% | 1.3% |
| Maximum | 9.8% | 20.8% |
| Range | 8.6% | 19.5% |
| Mean | 4.7% | 6.0% |
| Median | 4.5% | 5.4% |
| Interquartile 25% (IQ1) | 3.5% | 4.8% |
| Interquartile 75% (IQ3) | 5.7% | 6.5% |
| Interquartile Range (IQR) | 2.2% | 1.6% |
| Standard Deviation (Sample) | 1.8% | 3.0% |
| Standard Deviation (Population) | 1.8% | 2.9% |
Similar Demographics by Unemployment
Demographics Similar to Slovenes by Unemployment
In terms of unemployment, the demographic groups most similar to Slovenes are Immigrants from Venezuela (4.7%, a difference of 0.020%), Chinese (4.7%, a difference of 0.10%), Scottish (4.7%, a difference of 0.10%), European (4.6%, a difference of 0.24%), and Carpatho Rusyn (4.7%, a difference of 0.69%).
| Demographics | Rating | Rank | Unemployment |
| Dutch | 100.0 /100 | #10 | Exceptional 4.6% |
| English | 100.0 /100 | #11 | Exceptional 4.6% |
| Pennsylvania Germans | 100.0 /100 | #12 | Exceptional 4.6% |
| Belgians | 100.0 /100 | #13 | Exceptional 4.6% |
| Immigrants | Cuba | 100.0 /100 | #14 | Exceptional 4.6% |
| Europeans | 99.9 /100 | #15 | Exceptional 4.6% |
| Chinese | 99.9 /100 | #16 | Exceptional 4.7% |
| Slovenes | 99.9 /100 | #17 | Exceptional 4.7% |
| Immigrants | Venezuela | 99.9 /100 | #18 | Exceptional 4.7% |
| Scottish | 99.9 /100 | #19 | Exceptional 4.7% |
| Carpatho Rusyns | 99.9 /100 | #20 | Exceptional 4.7% |
| Welsh | 99.9 /100 | #21 | Exceptional 4.7% |
| Thais | 99.9 /100 | #22 | Exceptional 4.7% |
| British | 99.9 /100 | #23 | Exceptional 4.7% |
| Venezuelans | 99.9 /100 | #24 | Exceptional 4.7% |
Demographics Similar to Peruvians by Unemployment
In terms of unemployment, the demographic groups most similar to Peruvians are Immigrants from Uruguay (5.3%, a difference of 0.010%), Immigrants from Southern Europe (5.3%, a difference of 0.070%), Immigrants from Laos (5.3%, a difference of 0.080%), Immigrants from Israel (5.3%, a difference of 0.090%), and Immigrants from Afghanistan (5.3%, a difference of 0.10%).
| Demographics | Rating | Rank | Unemployment |
| Immigrants | Belarus | 35.6 /100 | #189 | Fair 5.3% |
| Arabs | 35.3 /100 | #190 | Fair 5.3% |
| Somalis | 34.0 /100 | #191 | Fair 5.3% |
| South Americans | 33.9 /100 | #192 | Fair 5.3% |
| Immigrants | Somalia | 33.8 /100 | #193 | Fair 5.3% |
| Immigrants | Laos | 30.9 /100 | #194 | Fair 5.3% |
| Immigrants | Southern Europe | 30.9 /100 | #195 | Fair 5.3% |
| Peruvians | 29.9 /100 | #196 | Fair 5.3% |
| Immigrants | Uruguay | 29.8 /100 | #197 | Fair 5.3% |
| Immigrants | Israel | 28.6 /100 | #198 | Fair 5.3% |
| Immigrants | Afghanistan | 28.6 /100 | #199 | Fair 5.3% |
| Koreans | 27.4 /100 | #200 | Fair 5.3% |
| Immigrants | South Eastern Asia | 27.0 /100 | #201 | Fair 5.3% |
| Cherokee | 25.5 /100 | #202 | Fair 5.3% |
| Immigrants | Micronesia | 25.2 /100 | #203 | Fair 5.3% |