Slovak vs Delaware Unemployment Among Ages 60 to 64 years

COMPARE

Slovak
Race
Ancestry
AfghanAfricanAlaska NativeAlaskan AthabascanAlbanianAleutAlsatianAmericanApacheArabArapahoArgentineanArmenianAssyrian/Chaldean/SyriacAustralianAustrianBahamianBangladeshiBarbadianBasqueBelgianBelizeanBermudanBhutaneseBlackfeetBolivianBrazilianBritishBritish West IndianBulgarianBurmeseCajunCambodianCanadianCape VerdeanCarpatho RusynCelticCentral AmericanCentral American IndianCherokeeCheyenneChickasawChileanChineseChippewaChoctawColombianColvilleComancheCosta RicanCreeCreekCroatianCrowCubanCypriotCzechCzechoslovakianDanishDominicanDutchDutch West IndianEastern EuropeanEcuadorianEgyptianEnglishEstonianEthiopianEuropeanFijianFilipinoFinnishFrenchFrench American IndianFrench CanadianGermanGerman RussianGhanaianGreekGuamanian/ChamorroGuatemalanGuyaneseHaitianHmongHonduranHopiHoumaHungarianIcelanderIndian (Asian)IndonesianInupiatIranianIraqiIrishIroquoisIsraeliItalianJamaicanJapaneseJordanianKenyanKiowaKoreanLaotianLatvianLebaneseLiberianLithuanianLumbeeLuxembourgerMacedonianMalaysianMalteseMarshalleseMenomineeMexicanMexican American IndianMongolianMoroccanNative HawaiianNavajoNepaleseNew ZealanderNicaraguanNigerianNorthern EuropeanNorwegianOkinawanOsageOttawaPaiutePakistaniPalestinianPanamanianParaguayanPennsylvania GermanPeruvianPimaPolishPortuguesePotawatomiPuebloPuerto RicanPuget Sound SalishRomanianRussianSalvadoranSamoanScandinavianScotch-IrishScottishSeminoleSenegaleseSerbianShoshoneSierra LeoneanSiouxSlavicSlovakSloveneSomaliSouth AfricanSouth AmericanSouth American IndianSoviet UnionSpaniardSpanishSpanish AmericanSpanish American IndianSri LankanSubsaharan AfricanSudaneseSwedishSwissSyrianTaiwaneseThaiTlingit-HaidaTohono O'OdhamTonganTrinidadian and TobagonianTsimshianTurkishU.S. Virgin IslanderUgandanUkrainianUruguayanUteVenezuelanVietnameseWelshWest IndianYakamaYaquiYugoslavianYumanYup'ikZimbabwean
Immigration
NonimmigrantsImmigrantsAfghanistanAfricaAlbaniaArgentinaArmeniaAsiaAustraliaAustriaBahamasBangladeshBarbadosBelarusBelgiumBelizeBoliviaBosnia and HerzegovinaBrazilBulgariaBurma/MyanmarCabo VerdeCambodiaCameroonCanadaCaribbeanCentral AmericaChileChinaColombiaCongoCosta RicaCroatiaCubaCzechoslovakiaDenmarkDominicaDominican RepublicEastern AfricaEastern AsiaEastern EuropeEcuadorEgyptEl SalvadorEnglandEritreaEthiopiaEuropeFijiFranceGermanyGhanaGreeceGrenadaGuatemalaGuyanaHaitiHondurasHong KongHungaryIndiaIndonesiaIranIraqIrelandIsraelItalyJamaicaJapanJordanKazakhstanKenyaKoreaKuwaitLaosLatin AmericaLatviaLebanonLiberiaLithuaniaMalaysiaMexicoMicronesiaMiddle AfricaMoldovaMoroccoNepalNetherlandsNicaraguaNigeriaNorth AmericaNorth MacedoniaNorthern AfricaNorthern EuropeNorwayOceaniaPakistanPanamaPeruPhilippinesPolandPortugalRomaniaRussiaSaudi ArabiaScotlandSenegalSerbiaSierra LeoneSingaporeSomaliaSouth AfricaSouth AmericaSouth Central AsiaSouth Eastern AsiaSouthern EuropeSpainSri LankaSt. Vincent and the GrenadinesSudanSwedenSwitzerlandSyriaTaiwanThailandTrinidad and TobagoTurkeyUgandaUkraineUruguayUzbekistanVenezuelaVietnamWest IndiesWestern AfricaWestern AsiaWestern EuropeYemenZaireZimbabweAzores
Delaware
Race
Ancestry
AfghanAfricanAlaska NativeAlaskan AthabascanAlbanianAleutAlsatianAmericanApacheArabArapahoArgentineanArmenianAssyrian/Chaldean/SyriacAustralianAustrianBahamianBangladeshiBarbadianBasqueBelgianBelizeanBermudanBhutaneseBlackfeetBolivianBrazilianBritishBritish West IndianBulgarianBurmeseCajunCambodianCanadianCape VerdeanCarpatho RusynCelticCentral AmericanCentral American IndianCherokeeCheyenneChickasawChileanChineseChippewaChoctawColombianColvilleComancheCosta RicanCreeCreekCroatianCrowCubanCypriotCzechCzechoslovakianDanishDelawareDominicanDutchDutch West IndianEastern EuropeanEcuadorianEgyptianEnglishEstonianEthiopianEuropeanFijianFilipinoFinnishFrenchFrench American IndianFrench CanadianGermanGerman RussianGhanaianGreekGuamanian/ChamorroGuatemalanGuyaneseHaitianHmongHonduranHopiHoumaHungarianIcelanderIndian (Asian)IndonesianInupiatIranianIraqiIrishIroquoisIsraeliItalianJamaicanJapaneseJordanianKenyanKiowaKoreanLaotianLatvianLebaneseLiberianLithuanianLumbeeLuxembourgerMacedonianMalaysianMalteseMarshalleseMenomineeMexicanMexican American IndianMongolianMoroccanNative HawaiianNavajoNepaleseNew ZealanderNicaraguanNigerianNorthern EuropeanNorwegianOkinawanOsageOttawaPaiutePakistaniPalestinianPanamanianParaguayanPennsylvania GermanPeruvianPimaPolishPortuguesePotawatomiPuebloPuerto RicanPuget Sound SalishRomanianRussianSalvadoranSamoanScandinavianScotch-IrishScottishSeminoleSenegaleseSerbianShoshoneSierra LeoneanSiouxSlavicSloveneSomaliSouth AfricanSouth AmericanSouth American IndianSoviet UnionSpaniardSpanishSpanish AmericanSpanish American IndianSri LankanSubsaharan AfricanSudaneseSwedishSwissSyrianTaiwaneseThaiTlingit-HaidaTohono O'OdhamTonganTrinidadian and TobagonianTsimshianTurkishU.S. Virgin IslanderUgandanUkrainianUruguayanUteVenezuelanVietnameseWelshWest IndianYakamaYaquiYugoslavianYumanYup'ikZimbabwean
Immigration
NonimmigrantsImmigrantsAfghanistanAfricaAlbaniaArgentinaArmeniaAsiaAustraliaAustriaBahamasBangladeshBarbadosBelarusBelgiumBelizeBoliviaBosnia and HerzegovinaBrazilBulgariaBurma/MyanmarCabo VerdeCambodiaCameroonCanadaCaribbeanCentral AmericaChileChinaColombiaCongoCosta RicaCroatiaCubaCzechoslovakiaDenmarkDominicaDominican RepublicEastern AfricaEastern AsiaEastern EuropeEcuadorEgyptEl SalvadorEnglandEritreaEthiopiaEuropeFijiFranceGermanyGhanaGreeceGrenadaGuatemalaGuyanaHaitiHondurasHong KongHungaryIndiaIndonesiaIranIraqIrelandIsraelItalyJamaicaJapanJordanKazakhstanKenyaKoreaKuwaitLaosLatin AmericaLatviaLebanonLiberiaLithuaniaMalaysiaMexicoMicronesiaMiddle AfricaMoldovaMoroccoNepalNetherlandsNicaraguaNigeriaNorth AmericaNorth MacedoniaNorthern AfricaNorthern EuropeNorwayOceaniaPakistanPanamaPeruPhilippinesPolandPortugalRomaniaRussiaSaudi ArabiaScotlandSenegalSerbiaSierra LeoneSingaporeSomaliaSouth AfricaSouth AmericaSouth Central AsiaSouth Eastern AsiaSouthern EuropeSpainSri LankaSt. Vincent and the GrenadinesSudanSwedenSwitzerlandSyriaTaiwanThailandTrinidad and TobagoTurkeyUgandaUkraineUruguayUzbekistanVenezuelaVietnamWest IndiesWestern AfricaWestern AsiaWestern EuropeYemenZaireZimbabweAzores
Unemployment Among Ages 60 to 64 years
Income
Poverty
Unemployment
Labor Participation
Family Structure
Vehicle Availability
Education Level
Disability

Unemployment Among Ages 60 to 64 years Comparison

Slovaks

Delaware

Exceptional
Tragic
4.6%
UNEMPLOYMENT AMONG AGES 60 TO 64 YEARS
99.3/ 100
METRIC RATING
76th/ 347
METRIC RANK
5.0%
UNEMPLOYMENT AMONG AGES 60 TO 64 YEARS
3.6/ 100
METRIC RATING
235th/ 347
METRIC RANK

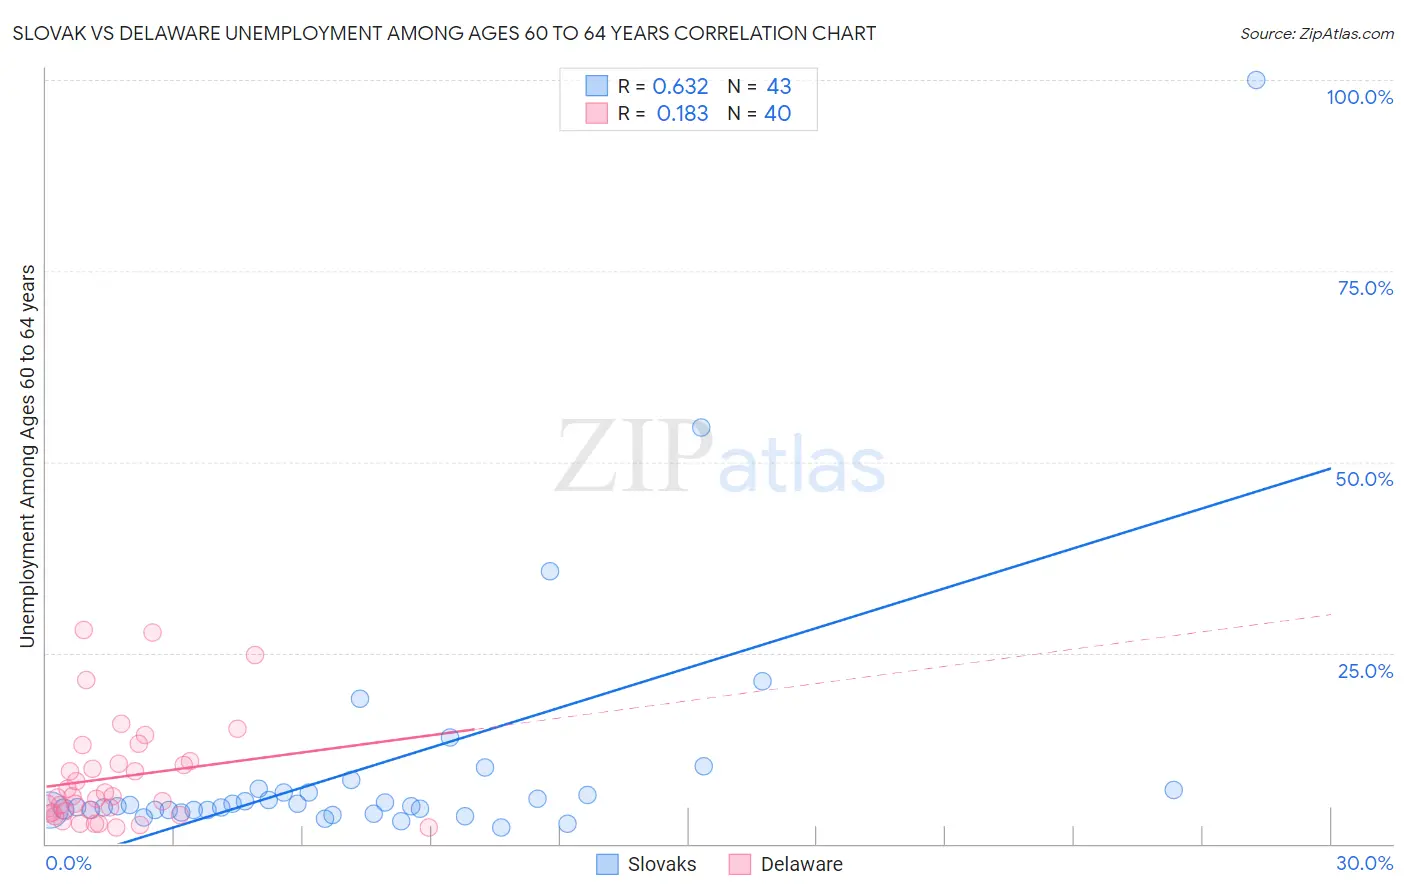
Slovak vs Delaware Unemployment Among Ages 60 to 64 years Correlation Chart

The statistical analysis conducted on geographies consisting of 354,864,568 people shows a significant positive correlation between the proportion of Slovaks and unemployment rate among population between the ages 60 and 64 in the United States with a correlation coefficient (R) of 0.632 and weighted average of 4.6%. Similarly, the statistical analysis conducted on geographies consisting of 91,764,865 people shows a poor positive correlation between the proportion of Delaware and unemployment rate among population between the ages 60 and 64 in the United States with a correlation coefficient (R) of 0.183 and weighted average of 5.0%, a difference of 7.5%.
Slovak vs Delaware Unemployment Among Ages 60 to 64 years

Unemployment Among Ages 60 to 64 years Correlation Summary

MeasurementSlovakDelaware
Minimum2.1%2.2%
Maximum100.0%28.0%
Range97.9%25.8%
Mean10.1%8.7%
Median4.9%6.1%
Interquartile 25% (IQ1)4.4%4.1%
Interquartile 75% (IQ3)7.0%10.6%
Interquartile Range (IQR)2.6%6.6%
Standard Deviation (Sample)16.9%6.8%
Standard Deviation (Population)16.7%6.7%

Similar Demographics by Unemployment Among Ages 60 to 64 years

Demographics Similar to Slovaks by Unemployment Among Ages 60 to 64 years

In terms of unemployment among ages 60 to 64 years, the demographic groups most similar to Slovaks are Immigrants from Somalia (4.6%, a difference of 0.020%), Potawatomi (4.6%, a difference of 0.030%), Seminole (4.7%, a difference of 0.070%), Irish (4.7%, a difference of 0.10%), and Northern European (4.6%, a difference of 0.13%).
DemographicsRating | RankUnemployment Among Ages 60 to 64 years
Creek
99.6
/100
|
#69
Exceptional
4.6%
Croatians
99.5
/100
|
#70
Exceptional
4.6%
Slavs
99.5
/100
|
#71
Exceptional
4.6%
Tongans
99.5
/100
|
#72
Exceptional
4.6%
Immigrants | Eastern Africa
99.5
/100
|
#73
Exceptional
4.6%
Northern Europeans
99.3
/100
|
#74
Exceptional
4.6%
Potawatomi
99.3
/100
|
#75
Exceptional
4.6%
Slovaks
99.3
/100
|
#76
Exceptional
4.6%
Immigrants | Somalia
99.2
/100
|
#77
Exceptional
4.6%
Seminole
99.2
/100
|
#78
Exceptional
4.7%
Irish
99.2
/100
|
#79
Exceptional
4.7%
Icelanders
99.1
/100
|
#80
Exceptional
4.7%
Iroquois
99.1
/100
|
#81
Exceptional
4.7%
Okinawans
99.1
/100
|
#82
Exceptional
4.7%
Immigrants | Egypt
99.1
/100
|
#83
Exceptional
4.7%

Demographics Similar to Delaware by Unemployment Among Ages 60 to 64 years

In terms of unemployment among ages 60 to 64 years, the demographic groups most similar to Delaware are Iranian (5.0%, a difference of 0.13%), Immigrants from Sierra Leone (5.0%, a difference of 0.13%), Immigrants from Western Asia (5.0%, a difference of 0.17%), Immigrants from Poland (5.0%, a difference of 0.17%), and Immigrants from Greece (5.0%, a difference of 0.23%).
DemographicsRating | RankUnemployment Among Ages 60 to 64 years
Immigrants | Belarus
6.4
/100
|
#228
Tragic
5.0%
Africans
5.9
/100
|
#229
Tragic
5.0%
Immigrants | Denmark
5.8
/100
|
#230
Tragic
5.0%
Tohono O'odham
5.7
/100
|
#231
Tragic
5.0%
Immigrants | Eastern Asia
4.7
/100
|
#232
Tragic
5.0%
Immigrants | Greece
4.6
/100
|
#233
Tragic
5.0%
Iranians
4.2
/100
|
#234
Tragic
5.0%
Delaware
3.6
/100
|
#235
Tragic
5.0%
Immigrants | Sierra Leone
3.1
/100
|
#236
Tragic
5.0%
Immigrants | Western Asia
3.0
/100
|
#237
Tragic
5.0%
Immigrants | Poland
3.0
/100
|
#238
Tragic
5.0%
Ghanaians
2.4
/100
|
#239
Tragic
5.0%
Immigrants | Croatia
2.2
/100
|
#240
Tragic
5.0%
Indians (Asian)
2.2
/100
|
#241
Tragic
5.0%
Argentineans
2.1
/100
|
#242
Tragic
5.0%