Slovak vs Cheyenne Unemployment Among Ages 65 to 74 years

COMPARE

Slovak
Race
Ancestry
AfghanAfricanAlaska NativeAlaskan AthabascanAlbanianAleutAlsatianAmericanApacheArabArapahoArgentineanArmenianAssyrian/Chaldean/SyriacAustralianAustrianBahamianBangladeshiBarbadianBasqueBelgianBelizeanBermudanBhutaneseBlackfeetBolivianBrazilianBritishBritish West IndianBulgarianBurmeseCajunCambodianCanadianCape VerdeanCarpatho RusynCelticCentral AmericanCentral American IndianCherokeeChickasawChileanChineseChippewaChoctawColombianColvilleComancheCosta RicanCreeCreekCroatianCrowCubanCypriotCzechCzechoslovakianDanishDelawareDominicanDutchDutch West IndianEastern EuropeanEcuadorianEgyptianEnglishEstonianEthiopianEuropeanFijianFilipinoFinnishFrenchFrench American IndianFrench CanadianGermanGerman RussianGhanaianGreekGuamanian/ChamorroGuatemalanGuyaneseHaitianHmongHonduranHopiHoumaHungarianIcelanderIndian (Asian)IndonesianInupiatIranianIraqiIrishIroquoisIsraeliItalianJamaicanJapaneseJordanianKenyanKiowaKoreanLaotianLatvianLebaneseLiberianLithuanianLumbeeLuxembourgerMacedonianMalaysianMalteseMarshalleseMenomineeMexicanMexican American IndianMongolianMoroccanNative HawaiianNavajoNepaleseNew ZealanderNicaraguanNigerianNorthern EuropeanNorwegianOkinawanOsageOttawaPaiutePakistaniPalestinianPanamanianParaguayanPennsylvania GermanPeruvianPimaPolishPortuguesePotawatomiPuebloPuerto RicanPuget Sound SalishRomanianRussianSalvadoranSamoanScandinavianScotch-IrishScottishSeminoleSenegaleseSerbianShoshoneSierra LeoneanSiouxSlavicSlovakSloveneSomaliSouth AfricanSouth AmericanSouth American IndianSoviet UnionSpaniardSpanishSpanish AmericanSpanish American IndianSri LankanSubsaharan AfricanSudaneseSwedishSwissSyrianTaiwaneseThaiTlingit-HaidaTohono O'OdhamTonganTrinidadian and TobagonianTsimshianTurkishU.S. Virgin IslanderUgandanUkrainianUruguayanUteVenezuelanVietnameseWelshWest IndianYakamaYaquiYugoslavianYumanYup'ikZimbabwean
Immigration
NonimmigrantsImmigrantsAfghanistanAfricaAlbaniaArgentinaArmeniaAsiaAustraliaAustriaBahamasBangladeshBarbadosBelarusBelgiumBelizeBoliviaBosnia and HerzegovinaBrazilBulgariaBurma/MyanmarCabo VerdeCambodiaCameroonCanadaCaribbeanCentral AmericaChileChinaColombiaCongoCosta RicaCroatiaCubaCzechoslovakiaDenmarkDominicaDominican RepublicEastern AfricaEastern AsiaEastern EuropeEcuadorEgyptEl SalvadorEnglandEritreaEthiopiaEuropeFijiFranceGermanyGhanaGreeceGrenadaGuatemalaGuyanaHaitiHondurasHong KongHungaryIndiaIndonesiaIranIraqIrelandIsraelItalyJamaicaJapanJordanKazakhstanKenyaKoreaKuwaitLaosLatin AmericaLatviaLebanonLiberiaLithuaniaMalaysiaMexicoMicronesiaMiddle AfricaMoldovaMoroccoNepalNetherlandsNicaraguaNigeriaNorth AmericaNorth MacedoniaNorthern AfricaNorthern EuropeNorwayOceaniaPakistanPanamaPeruPhilippinesPolandPortugalRomaniaRussiaSaudi ArabiaScotlandSenegalSerbiaSierra LeoneSingaporeSomaliaSouth AfricaSouth AmericaSouth Central AsiaSouth Eastern AsiaSouthern EuropeSpainSri LankaSt. Vincent and the GrenadinesSudanSwedenSwitzerlandSyriaTaiwanThailandTrinidad and TobagoTurkeyUgandaUkraineUruguayUzbekistanVenezuelaVietnamWest IndiesWestern AfricaWestern AsiaWestern EuropeYemenZaireZimbabweAzores
Cheyenne
Race
Ancestry
AfghanAfricanAlaska NativeAlaskan AthabascanAlbanianAleutAlsatianAmericanApacheArabArapahoArgentineanArmenianAssyrian/Chaldean/SyriacAustralianAustrianBahamianBangladeshiBarbadianBasqueBelgianBelizeanBermudanBhutaneseBlackfeetBolivianBrazilianBritishBritish West IndianBulgarianBurmeseCajunCambodianCanadianCape VerdeanCarpatho RusynCelticCentral AmericanCentral American IndianCherokeeCheyenneChickasawChileanChineseChippewaChoctawColombianColvilleComancheCosta RicanCreeCreekCroatianCrowCubanCypriotCzechCzechoslovakianDanishDelawareDominicanDutchDutch West IndianEastern EuropeanEcuadorianEgyptianEnglishEstonianEthiopianEuropeanFijianFilipinoFinnishFrenchFrench American IndianFrench CanadianGermanGerman RussianGhanaianGreekGuamanian/ChamorroGuatemalanGuyaneseHaitianHmongHonduranHopiHoumaHungarianIcelanderIndian (Asian)IndonesianInupiatIranianIraqiIrishIroquoisIsraeliItalianJamaicanJapaneseJordanianKenyanKiowaKoreanLaotianLatvianLebaneseLiberianLithuanianLumbeeLuxembourgerMacedonianMalaysianMalteseMarshalleseMenomineeMexicanMexican American IndianMongolianMoroccanNative HawaiianNavajoNepaleseNew ZealanderNicaraguanNigerianNorthern EuropeanNorwegianOkinawanOsageOttawaPaiutePakistaniPalestinianPanamanianParaguayanPennsylvania GermanPeruvianPimaPolishPortuguesePotawatomiPuebloPuerto RicanPuget Sound SalishRomanianRussianSalvadoranSamoanScandinavianScotch-IrishScottishSeminoleSenegaleseSerbianShoshoneSierra LeoneanSiouxSlavicSloveneSomaliSouth AfricanSouth AmericanSouth American IndianSoviet UnionSpaniardSpanishSpanish AmericanSpanish American IndianSri LankanSubsaharan AfricanSudaneseSwedishSwissSyrianTaiwaneseThaiTlingit-HaidaTohono O'OdhamTonganTrinidadian and TobagonianTsimshianTurkishU.S. Virgin IslanderUgandanUkrainianUruguayanUteVenezuelanVietnameseWelshWest IndianYakamaYaquiYugoslavianYumanYup'ikZimbabwean
Immigration
NonimmigrantsImmigrantsAfghanistanAfricaAlbaniaArgentinaArmeniaAsiaAustraliaAustriaBahamasBangladeshBarbadosBelarusBelgiumBelizeBoliviaBosnia and HerzegovinaBrazilBulgariaBurma/MyanmarCabo VerdeCambodiaCameroonCanadaCaribbeanCentral AmericaChileChinaColombiaCongoCosta RicaCroatiaCubaCzechoslovakiaDenmarkDominicaDominican RepublicEastern AfricaEastern AsiaEastern EuropeEcuadorEgyptEl SalvadorEnglandEritreaEthiopiaEuropeFijiFranceGermanyGhanaGreeceGrenadaGuatemalaGuyanaHaitiHondurasHong KongHungaryIndiaIndonesiaIranIraqIrelandIsraelItalyJamaicaJapanJordanKazakhstanKenyaKoreaKuwaitLaosLatin AmericaLatviaLebanonLiberiaLithuaniaMalaysiaMexicoMicronesiaMiddle AfricaMoldovaMoroccoNepalNetherlandsNicaraguaNigeriaNorth AmericaNorth MacedoniaNorthern AfricaNorthern EuropeNorwayOceaniaPakistanPanamaPeruPhilippinesPolandPortugalRomaniaRussiaSaudi ArabiaScotlandSenegalSerbiaSierra LeoneSingaporeSomaliaSouth AfricaSouth AmericaSouth Central AsiaSouth Eastern AsiaSouthern EuropeSpainSri LankaSt. Vincent and the GrenadinesSudanSwedenSwitzerlandSyriaTaiwanThailandTrinidad and TobagoTurkeyUgandaUkraineUruguayUzbekistanVenezuelaVietnamWest IndiesWestern AfricaWestern AsiaWestern EuropeYemenZaireZimbabweAzores
Unemployment Among Ages 65 to 74 years
Income
Poverty
Unemployment
Labor Participation
Family Structure
Vehicle Availability
Education Level
Disability

Unemployment Among Ages 65 to 74 years Comparison

Slovaks

Cheyenne

Good
Tragic
5.3%
UNEMPLOYMENT AMONG AGES 65 TO 74 YEARS
60.0/ 100
METRIC RATING
166th/ 347
METRIC RANK
5.8%
UNEMPLOYMENT AMONG AGES 65 TO 74 YEARS
0.0/ 100
METRIC RATING
306th/ 347
METRIC RANK

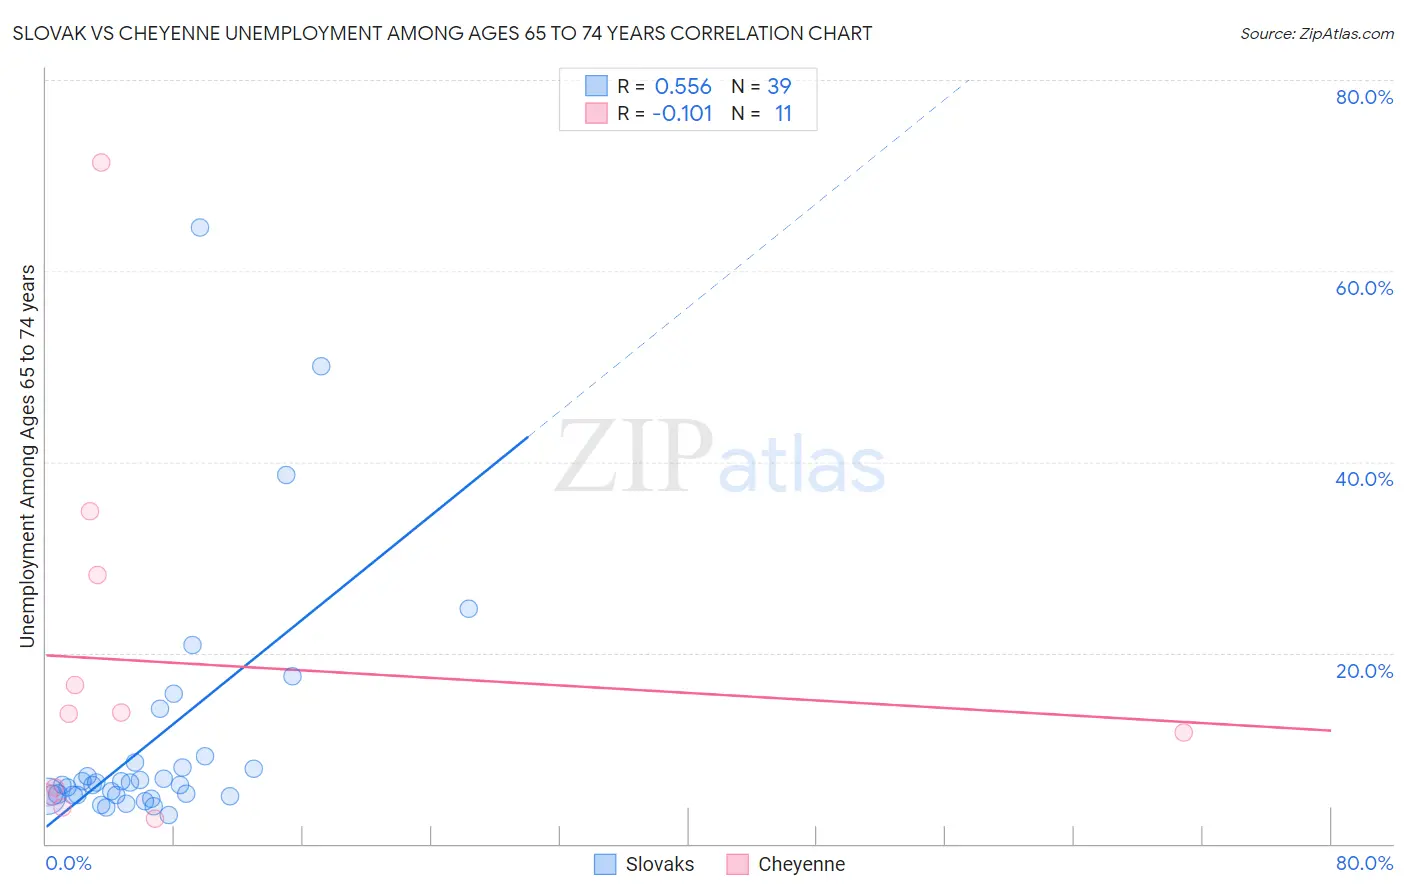
Slovak vs Cheyenne Unemployment Among Ages 65 to 74 years Correlation Chart

The statistical analysis conducted on geographies consisting of 344,296,008 people shows a substantial positive correlation between the proportion of Slovaks and unemployment rate among population between the ages 65 and 74 in the United States with a correlation coefficient (R) of 0.556 and weighted average of 5.3%. Similarly, the statistical analysis conducted on geographies consisting of 75,945,268 people shows a poor negative correlation between the proportion of Cheyenne and unemployment rate among population between the ages 65 and 74 in the United States with a correlation coefficient (R) of -0.101 and weighted average of 5.8%, a difference of 9.1%.
Slovak vs Cheyenne Unemployment Among Ages 65 to 74 years

Unemployment Among Ages 65 to 74 years Correlation Summary

MeasurementSlovakCheyenne
Minimum3.1%2.6%
Maximum64.6%71.4%
Range61.5%68.8%
Mean10.9%18.9%
Median6.2%13.7%
Interquartile 25% (IQ1)5.1%5.1%
Interquartile 75% (IQ3)8.4%28.2%
Interquartile Range (IQR)3.4%23.1%
Standard Deviation (Sample)13.0%20.1%
Standard Deviation (Population)12.8%19.2%

Similar Demographics by Unemployment Among Ages 65 to 74 years

Demographics Similar to Slovaks by Unemployment Among Ages 65 to 74 years

In terms of unemployment among ages 65 to 74 years, the demographic groups most similar to Slovaks are Indian (Asian) (5.3%, a difference of 0.0%), Immigrants from Bosnia and Herzegovina (5.3%, a difference of 0.010%), Immigrants from Philippines (5.3%, a difference of 0.040%), Mongolian (5.3%, a difference of 0.080%), and Immigrants from Eastern Asia (5.3%, a difference of 0.090%).
DemographicsRating | RankUnemployment Among Ages 65 to 74 years
Immigrants | Czechoslovakia
66.3
/100
|
#159
Good
5.3%
Bangladeshis
65.8
/100
|
#160
Good
5.3%
Immigrants | Italy
63.7
/100
|
#161
Good
5.3%
Immigrants | Eastern Asia
62.5
/100
|
#162
Good
5.3%
Mongolians
62.3
/100
|
#163
Good
5.3%
Immigrants | Philippines
61.2
/100
|
#164
Good
5.3%
Immigrants | Bosnia and Herzegovina
60.2
/100
|
#165
Good
5.3%
Slovaks
60.0
/100
|
#166
Good
5.3%
Indians (Asian)
59.9
/100
|
#167
Average
5.3%
Whites/Caucasians
57.2
/100
|
#168
Average
5.4%
Laotians
55.7
/100
|
#169
Average
5.4%
Syrians
53.7
/100
|
#170
Average
5.4%
Panamanians
51.8
/100
|
#171
Average
5.4%
Greeks
51.1
/100
|
#172
Average
5.4%
Immigrants | Northern Europe
51.1
/100
|
#173
Average
5.4%

Demographics Similar to Cheyenne by Unemployment Among Ages 65 to 74 years

In terms of unemployment among ages 65 to 74 years, the demographic groups most similar to Cheyenne are Mexican (5.8%, a difference of 0.0%), British West Indian (5.8%, a difference of 0.0%), Salvadoran (5.8%, a difference of 0.010%), Arapaho (5.8%, a difference of 0.020%), and Liberian (5.8%, a difference of 0.040%).
DemographicsRating | RankUnemployment Among Ages 65 to 74 years
Barbadians
0.0
/100
|
#299
Tragic
5.8%
Ecuadorians
0.0
/100
|
#300
Tragic
5.8%
Armenians
0.0
/100
|
#301
Tragic
5.8%
Liberians
0.0
/100
|
#302
Tragic
5.8%
Arapaho
0.0
/100
|
#303
Tragic
5.8%
Salvadorans
0.0
/100
|
#304
Tragic
5.8%
Mexicans
0.0
/100
|
#305
Tragic
5.8%
Cheyenne
0.0
/100
|
#306
Tragic
5.8%
British West Indians
0.0
/100
|
#307
Tragic
5.8%
Guatemalans
0.0
/100
|
#308
Tragic
5.8%
Immigrants | Ecuador
0.0
/100
|
#309
Tragic
5.8%
Immigrants | Bangladesh
0.0
/100
|
#310
Tragic
5.9%
Venezuelans
0.0
/100
|
#311
Tragic
5.9%
Hispanics or Latinos
0.0
/100
|
#312
Tragic
5.9%
Vietnamese
0.0
/100
|
#313
Tragic
5.9%