Slavic vs Okinawan Unemployment Among Ages 25 to 29 years

COMPARE

Slavic
Race
Ancestry
AfghanAfricanAlaska NativeAlaskan AthabascanAlbanianAleutAlsatianAmericanApacheArabArapahoArgentineanArmenianAssyrian/Chaldean/SyriacAustralianAustrianBahamianBangladeshiBarbadianBasqueBelgianBelizeanBermudanBhutaneseBlackfeetBolivianBrazilianBritishBritish West IndianBulgarianBurmeseCajunCambodianCanadianCape VerdeanCarpatho RusynCelticCentral AmericanCentral American IndianCherokeeCheyenneChickasawChileanChineseChippewaChoctawColombianColvilleComancheCosta RicanCreeCreekCroatianCrowCubanCypriotCzechCzechoslovakianDanishDelawareDominicanDutchDutch West IndianEastern EuropeanEcuadorianEgyptianEnglishEstonianEthiopianEuropeanFijianFilipinoFinnishFrenchFrench American IndianFrench CanadianGermanGerman RussianGhanaianGreekGuamanian/ChamorroGuatemalanGuyaneseHaitianHmongHonduranHopiHoumaHungarianIcelanderIndian (Asian)IndonesianInupiatIranianIraqiIrishIroquoisIsraeliItalianJamaicanJapaneseJordanianKenyanKiowaKoreanLaotianLatvianLebaneseLiberianLithuanianLumbeeLuxembourgerMacedonianMalaysianMalteseMarshalleseMenomineeMexicanMexican American IndianMongolianMoroccanNative HawaiianNavajoNepaleseNew ZealanderNicaraguanNigerianNorthern EuropeanNorwegianOsageOttawaPaiutePakistaniPalestinianPanamanianParaguayanPennsylvania GermanPeruvianPimaPolishPortuguesePotawatomiPuebloPuerto RicanPuget Sound SalishRomanianRussianSalvadoranSamoanScandinavianScotch-IrishScottishSeminoleSenegaleseSerbianShoshoneSierra LeoneanSiouxSlavicSlovakSloveneSomaliSouth AfricanSouth AmericanSouth American IndianSoviet UnionSpaniardSpanishSpanish AmericanSpanish American IndianSri LankanSubsaharan AfricanSudaneseSwedishSwissSyrianTaiwaneseThaiTlingit-HaidaTohono O'OdhamTonganTrinidadian and TobagonianTsimshianTurkishU.S. Virgin IslanderUgandanUkrainianUruguayanUteVenezuelanVietnameseWelshWest IndianYakamaYaquiYugoslavianYumanYup'ikZimbabwean
Immigration
NonimmigrantsImmigrantsAfghanistanAfricaAlbaniaArgentinaArmeniaAsiaAustraliaAustriaBahamasBangladeshBarbadosBelarusBelgiumBelizeBoliviaBosnia and HerzegovinaBrazilBulgariaBurma/MyanmarCabo VerdeCambodiaCameroonCanadaCaribbeanCentral AmericaChileChinaColombiaCongoCosta RicaCroatiaCubaCzechoslovakiaDenmarkDominicaDominican RepublicEastern AfricaEastern AsiaEastern EuropeEcuadorEgyptEl SalvadorEnglandEritreaEthiopiaEuropeFijiFranceGermanyGhanaGreeceGrenadaGuatemalaGuyanaHaitiHondurasHong KongHungaryIndiaIndonesiaIranIraqIrelandIsraelItalyJamaicaJapanJordanKazakhstanKenyaKoreaKuwaitLaosLatin AmericaLatviaLebanonLiberiaLithuaniaMalaysiaMexicoMicronesiaMiddle AfricaMoldovaMoroccoNepalNetherlandsNicaraguaNigeriaNorth AmericaNorth MacedoniaNorthern AfricaNorthern EuropeNorwayOceaniaPakistanPanamaPeruPhilippinesPolandPortugalRomaniaRussiaSaudi ArabiaScotlandSenegalSerbiaSierra LeoneSingaporeSomaliaSouth AfricaSouth AmericaSouth Central AsiaSouth Eastern AsiaSouthern EuropeSpainSri LankaSt. Vincent and the GrenadinesSudanSwedenSwitzerlandSyriaTaiwanThailandTrinidad and TobagoTurkeyUgandaUkraineUruguayUzbekistanVenezuelaVietnamWest IndiesWestern AfricaWestern AsiaWestern EuropeYemenZaireZimbabweAzores
Okinawan
Race
Ancestry
AfghanAfricanAlaska NativeAlaskan AthabascanAlbanianAleutAlsatianAmericanApacheArabArapahoArgentineanArmenianAssyrian/Chaldean/SyriacAustralianAustrianBahamianBangladeshiBarbadianBasqueBelgianBelizeanBermudanBhutaneseBlackfeetBolivianBrazilianBritishBritish West IndianBulgarianBurmeseCajunCambodianCanadianCape VerdeanCarpatho RusynCelticCentral AmericanCentral American IndianCherokeeCheyenneChickasawChileanChineseChippewaChoctawColombianColvilleComancheCosta RicanCreeCreekCroatianCrowCubanCypriotCzechCzechoslovakianDanishDelawareDominicanDutchDutch West IndianEastern EuropeanEcuadorianEgyptianEnglishEstonianEthiopianEuropeanFijianFilipinoFinnishFrenchFrench American IndianFrench CanadianGermanGerman RussianGhanaianGreekGuamanian/ChamorroGuatemalanGuyaneseHaitianHmongHonduranHopiHoumaHungarianIcelanderIndian (Asian)IndonesianInupiatIranianIraqiIrishIroquoisIsraeliItalianJamaicanJapaneseJordanianKenyanKiowaKoreanLaotianLatvianLebaneseLiberianLithuanianLumbeeLuxembourgerMacedonianMalaysianMalteseMarshalleseMenomineeMexicanMexican American IndianMongolianMoroccanNative HawaiianNavajoNepaleseNew ZealanderNicaraguanNigerianNorthern EuropeanNorwegianOkinawanOsageOttawaPaiutePakistaniPalestinianPanamanianParaguayanPennsylvania GermanPeruvianPimaPolishPortuguesePotawatomiPuebloPuerto RicanPuget Sound SalishRomanianRussianSalvadoranSamoanScandinavianScotch-IrishScottishSeminoleSenegaleseSerbianShoshoneSierra LeoneanSiouxSlovakSloveneSomaliSouth AfricanSouth AmericanSouth American IndianSoviet UnionSpaniardSpanishSpanish AmericanSpanish American IndianSri LankanSubsaharan AfricanSudaneseSwedishSwissSyrianTaiwaneseThaiTlingit-HaidaTohono O'OdhamTonganTrinidadian and TobagonianTsimshianTurkishU.S. Virgin IslanderUgandanUkrainianUruguayanUteVenezuelanVietnameseWelshWest IndianYakamaYaquiYugoslavianYumanYup'ikZimbabwean
Immigration
NonimmigrantsImmigrantsAfghanistanAfricaAlbaniaArgentinaArmeniaAsiaAustraliaAustriaBahamasBangladeshBarbadosBelarusBelgiumBelizeBoliviaBosnia and HerzegovinaBrazilBulgariaBurma/MyanmarCabo VerdeCambodiaCameroonCanadaCaribbeanCentral AmericaChileChinaColombiaCongoCosta RicaCroatiaCubaCzechoslovakiaDenmarkDominicaDominican RepublicEastern AfricaEastern AsiaEastern EuropeEcuadorEgyptEl SalvadorEnglandEritreaEthiopiaEuropeFijiFranceGermanyGhanaGreeceGrenadaGuatemalaGuyanaHaitiHondurasHong KongHungaryIndiaIndonesiaIranIraqIrelandIsraelItalyJamaicaJapanJordanKazakhstanKenyaKoreaKuwaitLaosLatin AmericaLatviaLebanonLiberiaLithuaniaMalaysiaMexicoMicronesiaMiddle AfricaMoldovaMoroccoNepalNetherlandsNicaraguaNigeriaNorth AmericaNorth MacedoniaNorthern AfricaNorthern EuropeNorwayOceaniaPakistanPanamaPeruPhilippinesPolandPortugalRomaniaRussiaSaudi ArabiaScotlandSenegalSerbiaSierra LeoneSingaporeSomaliaSouth AfricaSouth AmericaSouth Central AsiaSouth Eastern AsiaSouthern EuropeSpainSri LankaSt. Vincent and the GrenadinesSudanSwedenSwitzerlandSyriaTaiwanThailandTrinidad and TobagoTurkeyUgandaUkraineUruguayUzbekistanVenezuelaVietnamWest IndiesWestern AfricaWestern AsiaWestern EuropeYemenZaireZimbabweAzores
Unemployment Among Ages 25 to 29 years
Income
Poverty
Unemployment
Labor Participation
Family Structure
Vehicle Availability
Education Level
Disability

Unemployment Among Ages 25 to 29 years Comparison

Slavs

Okinawans

Good
Exceptional
6.5%
UNEMPLOYMENT AMONG AGES 25 TO 29 YEARS
72.5/ 100
METRIC RATING
142nd/ 347
METRIC RANK
5.9%
UNEMPLOYMENT AMONG AGES 25 TO 29 YEARS
100.0/ 100
METRIC RATING
12th/ 347
METRIC RANK

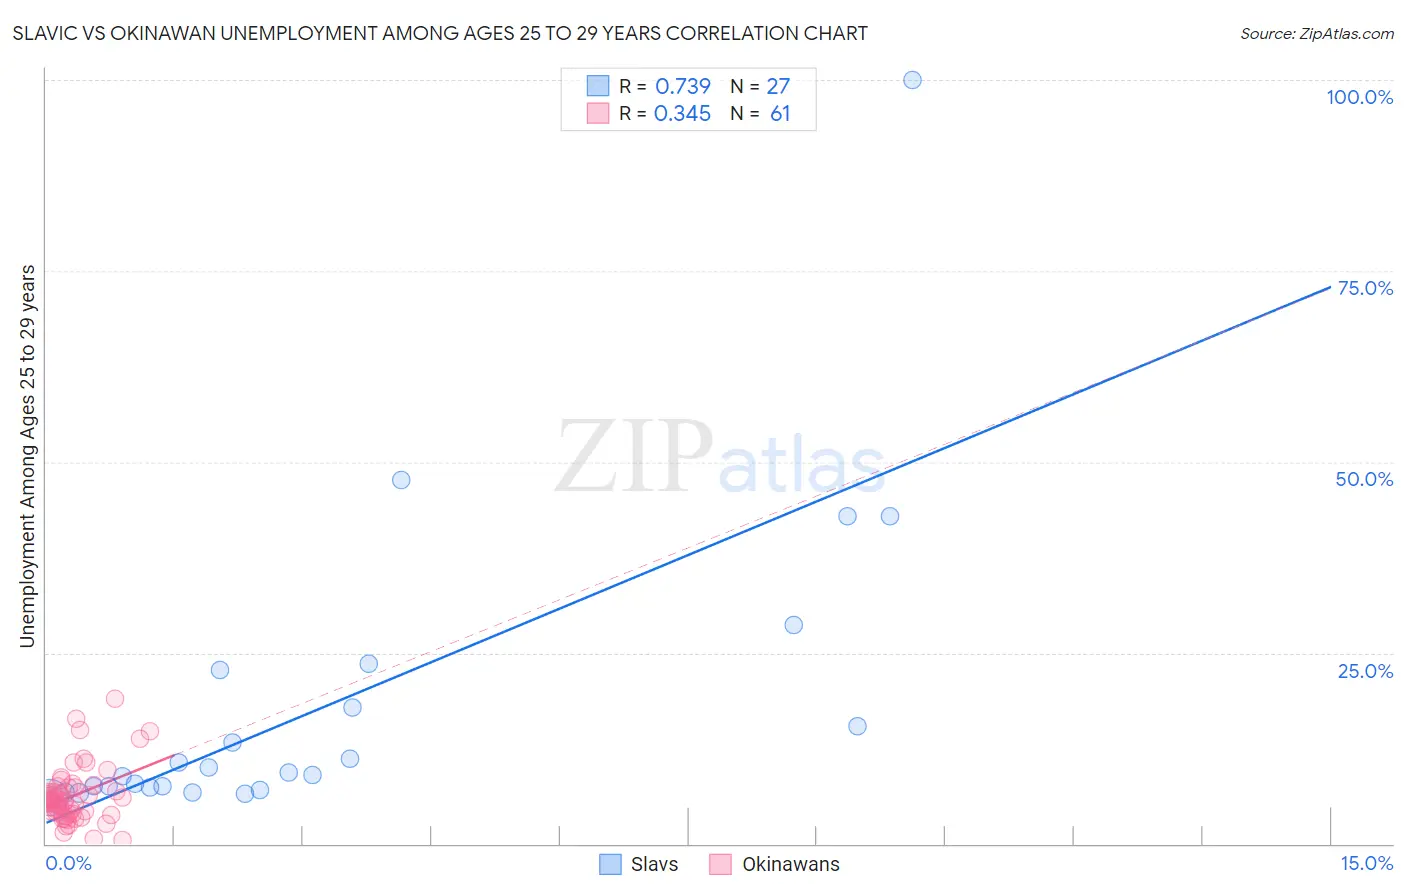
Slavic vs Okinawan Unemployment Among Ages 25 to 29 years Correlation Chart

The statistical analysis conducted on geographies consisting of 259,335,630 people shows a strong positive correlation between the proportion of Slavs and unemployment rate among population between the ages 25 and 29 in the United States with a correlation coefficient (R) of 0.739 and weighted average of 6.5%. Similarly, the statistical analysis conducted on geographies consisting of 73,094,975 people shows a mild positive correlation between the proportion of Okinawans and unemployment rate among population between the ages 25 and 29 in the United States with a correlation coefficient (R) of 0.345 and weighted average of 5.9%, a difference of 11.9%.
Slavic vs Okinawan Unemployment Among Ages 25 to 29 years

Unemployment Among Ages 25 to 29 years Correlation Summary

MeasurementSlavicOkinawan
Minimum6.1%0.50%
Maximum100.0%19.0%
Range93.9%18.5%
Mean18.2%6.3%
Median9.4%5.6%
Interquartile 25% (IQ1)7.4%3.9%
Interquartile 75% (IQ3)22.8%7.4%
Interquartile Range (IQR)15.4%3.5%
Standard Deviation (Sample)20.3%3.7%
Standard Deviation (Population)20.0%3.6%

Similar Demographics by Unemployment Among Ages 25 to 29 years

Demographics Similar to Slavs by Unemployment Among Ages 25 to 29 years

In terms of unemployment among ages 25 to 29 years, the demographic groups most similar to Slavs are Lithuanian (6.5%, a difference of 0.020%), Maltese (6.5%, a difference of 0.030%), Immigrants from Micronesia (6.6%, a difference of 0.080%), Immigrants from Belgium (6.5%, a difference of 0.10%), and Austrian (6.5%, a difference of 0.10%).
DemographicsRating | RankUnemployment Among Ages 25 to 29 years
Immigrants | Croatia
75.5
/100
|
#135
Good
6.5%
Northern Europeans
75.4
/100
|
#136
Good
6.5%
Eastern Europeans
74.1
/100
|
#137
Good
6.5%
Immigrants | Belgium
73.8
/100
|
#138
Good
6.5%
Austrians
73.8
/100
|
#139
Good
6.5%
Immigrants | Pakistan
73.8
/100
|
#140
Good
6.5%
Maltese
72.9
/100
|
#141
Good
6.5%
Slavs
72.5
/100
|
#142
Good
6.5%
Lithuanians
72.2
/100
|
#143
Good
6.5%
Immigrants | Micronesia
71.5
/100
|
#144
Good
6.6%
Nicaraguans
70.2
/100
|
#145
Good
6.6%
Romanians
69.5
/100
|
#146
Good
6.6%
Immigrants | Thailand
68.4
/100
|
#147
Good
6.6%
Peruvians
68.1
/100
|
#148
Good
6.6%
Malaysians
67.1
/100
|
#149
Good
6.6%

Demographics Similar to Okinawans by Unemployment Among Ages 25 to 29 years

In terms of unemployment among ages 25 to 29 years, the demographic groups most similar to Okinawans are Immigrants from Bolivia (5.9%, a difference of 0.030%), Cambodian (5.8%, a difference of 0.12%), Immigrants from Kuwait (5.9%, a difference of 0.65%), Cuban (5.9%, a difference of 1.0%), and Immigrants from Bulgaria (5.9%, a difference of 1.0%).
DemographicsRating | RankUnemployment Among Ages 25 to 29 years
Somalis
100.0
/100
|
#5
Exceptional
5.6%
Hmong
100.0
/100
|
#6
Exceptional
5.7%
Immigrants | India
100.0
/100
|
#7
Exceptional
5.7%
Immigrants | Bosnia and Herzegovina
100.0
/100
|
#8
Exceptional
5.7%
Immigrants | Nepal
100.0
/100
|
#9
Exceptional
5.7%
Immigrants | Sudan
100.0
/100
|
#10
Exceptional
5.8%
Cambodians
100.0
/100
|
#11
Exceptional
5.8%
Okinawans
100.0
/100
|
#12
Exceptional
5.9%
Immigrants | Bolivia
100.0
/100
|
#13
Exceptional
5.9%
Immigrants | Kuwait
99.9
/100
|
#14
Exceptional
5.9%
Cubans
99.9
/100
|
#15
Exceptional
5.9%
Immigrants | Bulgaria
99.9
/100
|
#16
Exceptional
5.9%
Bolivians
99.9
/100
|
#17
Exceptional
5.9%
Immigrants | Singapore
99.9
/100
|
#18
Exceptional
5.9%
Thais
99.9
/100
|
#19
Exceptional
5.9%