Sioux vs Norwegian Male Unemployment
COMPARE
Sioux
Norwegian
Male Unemployment
Male Unemployment Comparison
Sioux
Norwegians
8.4%
MALE UNEMPLOYMENT
0.0/ 100
METRIC RATING
333rd/ 347
METRIC RANK
4.4%
MALE UNEMPLOYMENT
100.0/ 100
METRIC RATING
3rd/ 347
METRIC RANK
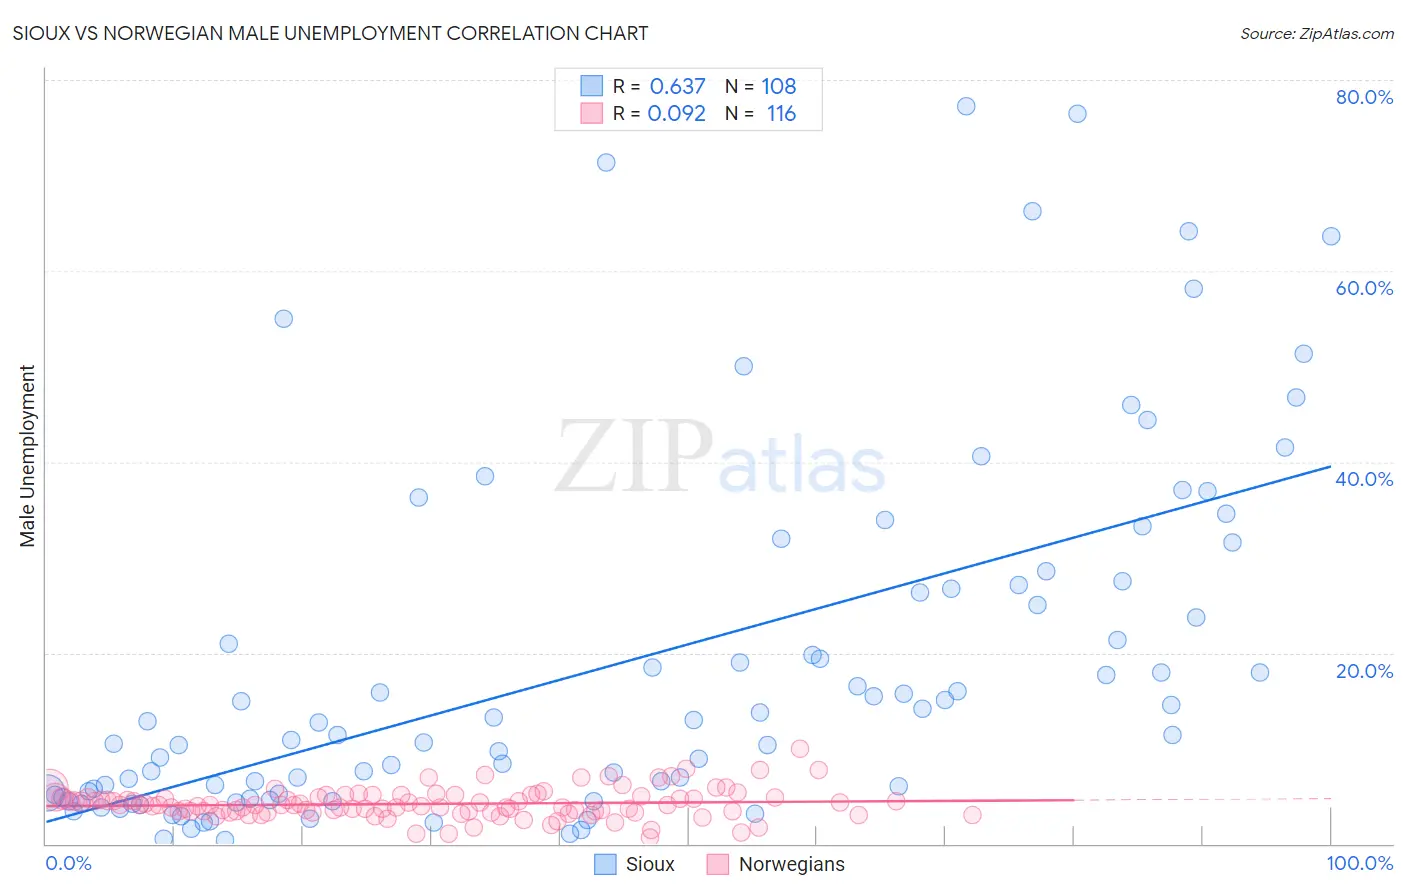
Sioux vs Norwegian Male Unemployment Correlation Chart
The statistical analysis conducted on geographies consisting of 232,900,714 people shows a significant positive correlation between the proportion of Sioux and unemployment rate among males in the United States with a correlation coefficient (R) of 0.637 and weighted average of 8.4%. Similarly, the statistical analysis conducted on geographies consisting of 525,648,173 people shows a slight positive correlation between the proportion of Norwegians and unemployment rate among males in the United States with a correlation coefficient (R) of 0.092 and weighted average of 4.4%, a difference of 89.0%.
Male Unemployment Correlation Summary
| Measurement | Sioux | Norwegian |
| Minimum | 0.40% | 0.60% |
| Maximum | 77.3% | 10.0% |
| Range | 76.9% | 9.4% |
| Mean | 18.8% | 4.2% |
| Median | 12.1% | 4.0% |
| Interquartile 25% (IQ1) | 5.1% | 3.4% |
| Interquartile 75% (IQ3) | 26.9% | 4.8% |
| Interquartile Range (IQR) | 21.8% | 1.5% |
| Standard Deviation (Sample) | 18.6% | 1.5% |
| Standard Deviation (Population) | 18.5% | 1.5% |
Similar Demographics by Male Unemployment
Demographics Similar to Sioux by Male Unemployment
In terms of male unemployment, the demographic groups most similar to Sioux are Tsimshian (8.5%, a difference of 0.97%), Pueblo (8.5%, a difference of 1.0%), Pima (8.3%, a difference of 1.3%), Yuman (8.6%, a difference of 2.4%), and Puerto Rican (8.6%, a difference of 2.5%).
| Demographics | Rating | Rank | Male Unemployment |
| Immigrants | Dominican Republic | 0.0 /100 | #326 | Tragic 7.6% |
| Paiute | 0.0 /100 | #327 | Tragic 7.7% |
| Natives/Alaskans | 0.0 /100 | #328 | Tragic 7.7% |
| Immigrants | Yemen | 0.0 /100 | #329 | Tragic 7.8% |
| Yakama | 0.0 /100 | #330 | Tragic 7.9% |
| Alaska Natives | 0.0 /100 | #331 | Tragic 8.1% |
| Pima | 0.0 /100 | #332 | Tragic 8.3% |
| Sioux | 0.0 /100 | #333 | Tragic 8.4% |
| Tsimshian | 0.0 /100 | #334 | Tragic 8.5% |
| Pueblo | 0.0 /100 | #335 | Tragic 8.5% |
| Yuman | 0.0 /100 | #336 | Tragic 8.6% |
| Puerto Ricans | 0.0 /100 | #337 | Tragic 8.6% |
| Apache | 0.0 /100 | #338 | Tragic 8.6% |
| Cheyenne | 0.0 /100 | #339 | Tragic 9.8% |
| Alaskan Athabascans | 0.0 /100 | #340 | Tragic 9.8% |
Demographics Similar to Norwegians by Male Unemployment
In terms of male unemployment, the demographic groups most similar to Norwegians are Immigrants from Cuba (4.4%, a difference of 0.24%), Immigrants from Venezuela (4.4%, a difference of 0.33%), Immigrants from India (4.4%, a difference of 1.3%), Danish (4.5%, a difference of 1.4%), and Venezuelan (4.5%, a difference of 1.8%).
| Demographics | Rating | Rank | Male Unemployment |
| Immigrants | India | 100.0 /100 | #1 | Exceptional 4.4% |
| Immigrants | Cuba | 100.0 /100 | #2 | Exceptional 4.4% |
| Norwegians | 100.0 /100 | #3 | Exceptional 4.4% |
| Immigrants | Venezuela | 100.0 /100 | #4 | Exceptional 4.4% |
| Danes | 100.0 /100 | #5 | Exceptional 4.5% |
| Venezuelans | 100.0 /100 | #6 | Exceptional 4.5% |
| Czechs | 100.0 /100 | #7 | Exceptional 4.5% |
| Luxembourgers | 100.0 /100 | #8 | Exceptional 4.5% |
| Thais | 100.0 /100 | #9 | Exceptional 4.6% |
| Cubans | 100.0 /100 | #10 | Exceptional 4.6% |
| Swedes | 100.0 /100 | #11 | Exceptional 4.6% |
| Immigrants | Bolivia | 100.0 /100 | #12 | Exceptional 4.7% |
| Bolivians | 100.0 /100 | #13 | Exceptional 4.7% |
| Germans | 100.0 /100 | #14 | Exceptional 4.7% |
| Scandinavians | 100.0 /100 | #15 | Exceptional 4.7% |