Sioux vs Belgian Unemployment Among Ages 60 to 64 years
COMPARE
Sioux
Belgian
Unemployment Among Ages 60 to 64 years
Unemployment Among Ages 60 to 64 years Comparison
Sioux
Belgians
5.1%
UNEMPLOYMENT AMONG AGES 60 TO 64 YEARS
0.3/ 100
METRIC RATING
264th/ 347
METRIC RANK
4.5%
UNEMPLOYMENT AMONG AGES 60 TO 64 YEARS
100.0/ 100
METRIC RATING
34th/ 347
METRIC RANK
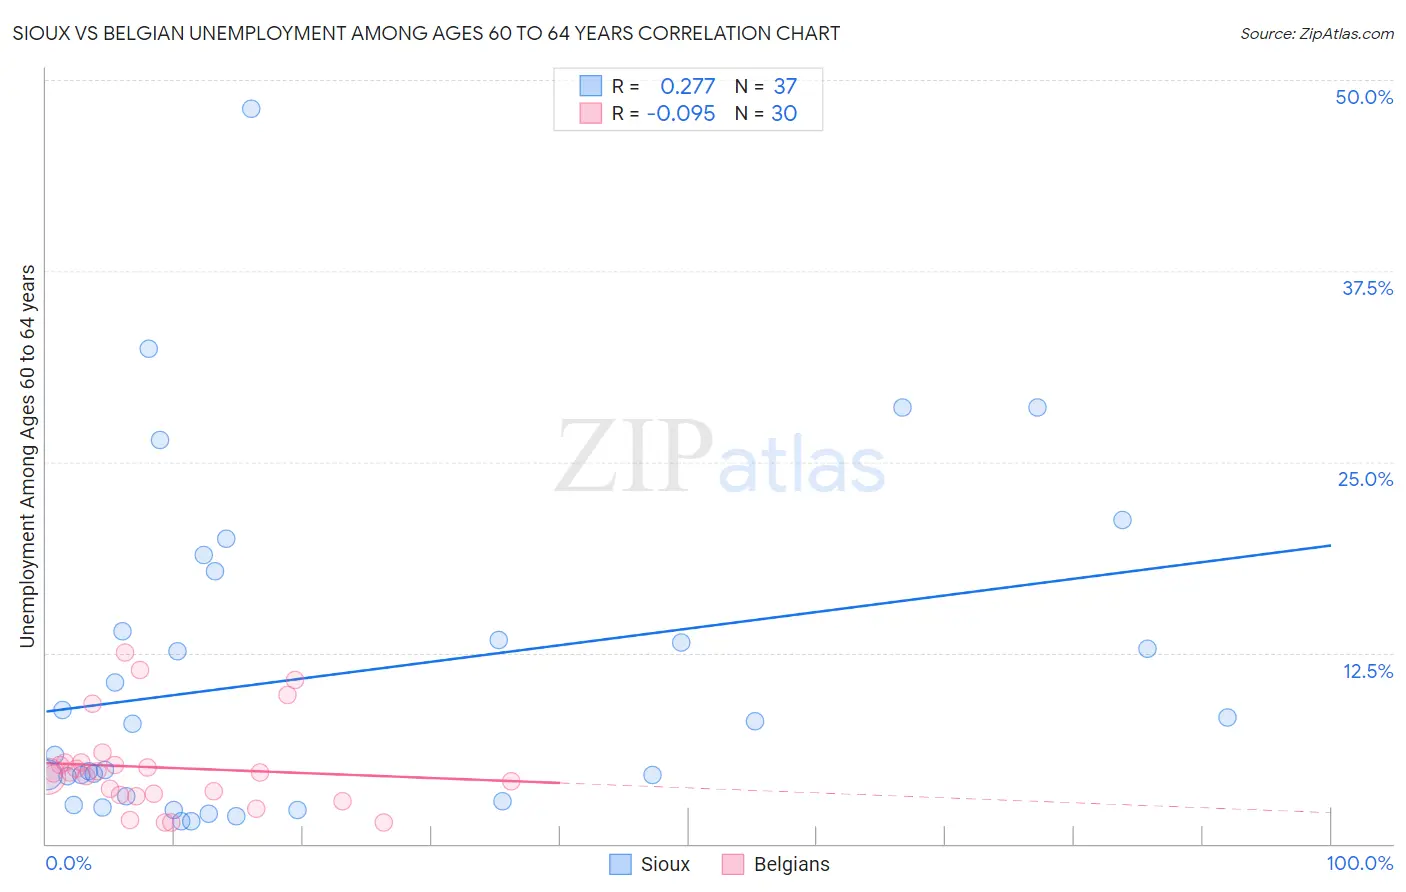
Sioux vs Belgian Unemployment Among Ages 60 to 64 years Correlation Chart
The statistical analysis conducted on geographies consisting of 214,355,270 people shows a weak positive correlation between the proportion of Sioux and unemployment rate among population between the ages 60 and 64 in the United States with a correlation coefficient (R) of 0.277 and weighted average of 5.1%. Similarly, the statistical analysis conducted on geographies consisting of 318,582,400 people shows a slight negative correlation between the proportion of Belgians and unemployment rate among population between the ages 60 and 64 in the United States with a correlation coefficient (R) of -0.095 and weighted average of 4.5%, a difference of 13.7%.
Unemployment Among Ages 60 to 64 years Correlation Summary
| Measurement | Sioux | Belgian |
| Minimum | 1.5% | 1.4% |
| Maximum | 48.1% | 12.5% |
| Range | 46.6% | 11.1% |
| Mean | 11.1% | 5.0% |
| Median | 7.8% | 4.6% |
| Interquartile 25% (IQ1) | 3.0% | 3.2% |
| Interquartile 75% (IQ3) | 15.9% | 5.3% |
| Interquartile Range (IQR) | 12.9% | 2.1% |
| Standard Deviation (Sample) | 10.7% | 2.9% |
| Standard Deviation (Population) | 10.6% | 2.9% |
Similar Demographics by Unemployment Among Ages 60 to 64 years
Demographics Similar to Sioux by Unemployment Among Ages 60 to 64 years
In terms of unemployment among ages 60 to 64 years, the demographic groups most similar to Sioux are Immigrants (5.1%, a difference of 0.080%), Immigrants from Uzbekistan (5.1%, a difference of 0.10%), Immigrants from Ghana (5.1%, a difference of 0.12%), Immigrants from Honduras (5.1%, a difference of 0.22%), and Immigrants from Argentina (5.1%, a difference of 0.34%).
| Demographics | Rating | Rank | Unemployment Among Ages 60 to 64 years |
| Japanese | 0.6 /100 | #257 | Tragic 5.1% |
| Celtics | 0.5 /100 | #258 | Tragic 5.1% |
| Hondurans | 0.5 /100 | #259 | Tragic 5.1% |
| Immigrants | Honduras | 0.4 /100 | #260 | Tragic 5.1% |
| Immigrants | Ghana | 0.4 /100 | #261 | Tragic 5.1% |
| Immigrants | Uzbekistan | 0.4 /100 | #262 | Tragic 5.1% |
| Immigrants | Immigrants | 0.4 /100 | #263 | Tragic 5.1% |
| Sioux | 0.3 /100 | #264 | Tragic 5.1% |
| Immigrants | Argentina | 0.2 /100 | #265 | Tragic 5.1% |
| Immigrants | Australia | 0.2 /100 | #266 | Tragic 5.1% |
| Immigrants | Bahamas | 0.2 /100 | #267 | Tragic 5.1% |
| Central American Indians | 0.2 /100 | #268 | Tragic 5.1% |
| Immigrants | Costa Rica | 0.2 /100 | #269 | Tragic 5.1% |
| Immigrants | Iran | 0.1 /100 | #270 | Tragic 5.1% |
| Israelis | 0.1 /100 | #271 | Tragic 5.2% |
Demographics Similar to Belgians by Unemployment Among Ages 60 to 64 years
In terms of unemployment among ages 60 to 64 years, the demographic groups most similar to Belgians are German (4.5%, a difference of 0.020%), Venezuelan (4.5%, a difference of 0.030%), Immigrants from Portugal (4.5%, a difference of 0.060%), Carpatho Rusyn (4.5%, a difference of 0.26%), and Native Hawaiian (4.5%, a difference of 0.26%).
| Demographics | Rating | Rank | Unemployment Among Ages 60 to 64 years |
| Immigrants | Iraq | 100.0 /100 | #27 | Exceptional 4.5% |
| Immigrants | Nepal | 100.0 /100 | #28 | Exceptional 4.5% |
| Cubans | 100.0 /100 | #29 | Exceptional 4.5% |
| Immigrants | Venezuela | 100.0 /100 | #30 | Exceptional 4.5% |
| Immigrants | Eritrea | 100.0 /100 | #31 | Exceptional 4.5% |
| Zimbabweans | 100.0 /100 | #32 | Exceptional 4.5% |
| Carpatho Rusyns | 100.0 /100 | #33 | Exceptional 4.5% |
| Belgians | 100.0 /100 | #34 | Exceptional 4.5% |
| Germans | 100.0 /100 | #35 | Exceptional 4.5% |
| Venezuelans | 100.0 /100 | #36 | Exceptional 4.5% |
| Immigrants | Portugal | 100.0 /100 | #37 | Exceptional 4.5% |
| Native Hawaiians | 100.0 /100 | #38 | Exceptional 4.5% |
| Iraqis | 100.0 /100 | #39 | Exceptional 4.5% |
| Scandinavians | 100.0 /100 | #40 | Exceptional 4.5% |
| Immigrants | Sudan | 100.0 /100 | #41 | Exceptional 4.5% |