Shoshone vs Arab Unemployment Among Women with Children Under 6 years

COMPARE

Shoshone
Race
Ancestry
AfghanAfricanAlaska NativeAlaskan AthabascanAlbanianAleutAlsatianAmericanApacheArapahoArgentineanArmenianAssyrian/Chaldean/SyriacAustralianAustrianBahamianBangladeshiBarbadianBasqueBelgianBelizeanBermudanBhutaneseBlackfeetBolivianBrazilianBritishBritish West IndianBulgarianBurmeseCajunCambodianCanadianCape VerdeanCarpatho RusynCelticCentral AmericanCentral American IndianCherokeeCheyenneChickasawChileanChineseChippewaChoctawColombianColvilleComancheCosta RicanCreeCreekCroatianCrowCubanCypriotCzechCzechoslovakianDanishDelawareDominicanDutchDutch West IndianEastern EuropeanEcuadorianEgyptianEnglishEstonianEthiopianEuropeanFijianFilipinoFinnishFrenchFrench American IndianFrench CanadianGermanGerman RussianGhanaianGreekGuamanian/ChamorroGuatemalanGuyaneseHaitianHmongHonduranHopiHoumaHungarianIcelanderIndian (Asian)IndonesianInupiatIranianIraqiIrishIroquoisIsraeliItalianJamaicanJapaneseJordanianKenyanKiowaKoreanLaotianLatvianLebaneseLiberianLithuanianLumbeeLuxembourgerMacedonianMalaysianMalteseMarshalleseMenomineeMexicanMexican American IndianMongolianMoroccanNative HawaiianNavajoNepaleseNew ZealanderNicaraguanNigerianNorthern EuropeanNorwegianOkinawanOsageOttawaPaiutePakistaniPalestinianPanamanianParaguayanPennsylvania GermanPeruvianPimaPolishPortuguesePotawatomiPuebloPuerto RicanPuget Sound SalishRomanianRussianSalvadoranSamoanScandinavianScotch-IrishScottishSeminoleSenegaleseSerbianShoshoneSierra LeoneanSiouxSlavicSlovakSloveneSomaliSouth AfricanSouth AmericanSouth American IndianSoviet UnionSpaniardSpanishSpanish AmericanSpanish American IndianSri LankanSubsaharan AfricanSudaneseSwedishSwissSyrianTaiwaneseThaiTlingit-HaidaTohono O'OdhamTonganTrinidadian and TobagonianTsimshianTurkishU.S. Virgin IslanderUgandanUkrainianUruguayanUteVenezuelanVietnameseWelshWest IndianYakamaYaquiYugoslavianYumanYup'ikZimbabwean
Immigration
NonimmigrantsImmigrantsAfghanistanAfricaAlbaniaArgentinaArmeniaAsiaAustraliaAustriaBahamasBangladeshBarbadosBelarusBelgiumBelizeBoliviaBosnia and HerzegovinaBrazilBulgariaBurma/MyanmarCabo VerdeCambodiaCameroonCanadaCaribbeanCentral AmericaChileChinaColombiaCongoCosta RicaCroatiaCubaCzechoslovakiaDenmarkDominicaDominican RepublicEastern AfricaEastern AsiaEastern EuropeEcuadorEgyptEl SalvadorEnglandEritreaEthiopiaEuropeFijiFranceGermanyGhanaGreeceGrenadaGuatemalaGuyanaHaitiHondurasHong KongHungaryIndiaIndonesiaIranIraqIrelandIsraelItalyJamaicaJapanJordanKazakhstanKenyaKoreaKuwaitLaosLatin AmericaLatviaLebanonLiberiaLithuaniaMalaysiaMexicoMicronesiaMiddle AfricaMoldovaMoroccoNepalNetherlandsNicaraguaNigeriaNorth AmericaNorth MacedoniaNorthern AfricaNorthern EuropeNorwayOceaniaPakistanPanamaPeruPhilippinesPolandPortugalRomaniaRussiaSaudi ArabiaScotlandSenegalSerbiaSierra LeoneSingaporeSomaliaSouth AfricaSouth AmericaSouth Central AsiaSouth Eastern AsiaSouthern EuropeSpainSri LankaSt. Vincent and the GrenadinesSudanSwedenSwitzerlandSyriaTaiwanThailandTrinidad and TobagoTurkeyUgandaUkraineUruguayUzbekistanVenezuelaVietnamWest IndiesWestern AfricaWestern AsiaWestern EuropeYemenZaireZimbabweAzores
Arab
Race
Ancestry
AfghanAfricanAlaska NativeAlaskan AthabascanAlbanianAleutAlsatianAmericanApacheArabArapahoArgentineanArmenianAssyrian/Chaldean/SyriacAustralianAustrianBahamianBangladeshiBarbadianBasqueBelgianBelizeanBermudanBhutaneseBlackfeetBolivianBrazilianBritishBritish West IndianBulgarianBurmeseCajunCambodianCanadianCape VerdeanCarpatho RusynCelticCentral AmericanCentral American IndianCherokeeCheyenneChickasawChileanChineseChippewaChoctawColombianColvilleComancheCosta RicanCreeCreekCroatianCrowCubanCypriotCzechCzechoslovakianDanishDelawareDominicanDutchDutch West IndianEastern EuropeanEcuadorianEgyptianEnglishEstonianEthiopianEuropeanFijianFilipinoFinnishFrenchFrench American IndianFrench CanadianGermanGerman RussianGhanaianGreekGuamanian/ChamorroGuatemalanGuyaneseHaitianHmongHonduranHopiHoumaHungarianIcelanderIndian (Asian)IndonesianInupiatIranianIraqiIrishIroquoisIsraeliItalianJamaicanJapaneseJordanianKenyanKiowaKoreanLaotianLatvianLebaneseLiberianLithuanianLumbeeLuxembourgerMacedonianMalaysianMalteseMarshalleseMenomineeMexicanMexican American IndianMongolianMoroccanNative HawaiianNavajoNepaleseNew ZealanderNicaraguanNigerianNorthern EuropeanNorwegianOkinawanOsageOttawaPaiutePakistaniPalestinianPanamanianParaguayanPennsylvania GermanPeruvianPimaPolishPortuguesePotawatomiPuebloPuerto RicanPuget Sound SalishRomanianRussianSalvadoranSamoanScandinavianScotch-IrishScottishSeminoleSenegaleseSerbianSierra LeoneanSiouxSlavicSlovakSloveneSomaliSouth AfricanSouth AmericanSouth American IndianSoviet UnionSpaniardSpanishSpanish AmericanSpanish American IndianSri LankanSubsaharan AfricanSudaneseSwedishSwissSyrianTaiwaneseThaiTlingit-HaidaTohono O'OdhamTonganTrinidadian and TobagonianTsimshianTurkishU.S. Virgin IslanderUgandanUkrainianUruguayanUteVenezuelanVietnameseWelshWest IndianYakamaYaquiYugoslavianYumanYup'ikZimbabwean
Immigration
NonimmigrantsImmigrantsAfghanistanAfricaAlbaniaArgentinaArmeniaAsiaAustraliaAustriaBahamasBangladeshBarbadosBelarusBelgiumBelizeBoliviaBosnia and HerzegovinaBrazilBulgariaBurma/MyanmarCabo VerdeCambodiaCameroonCanadaCaribbeanCentral AmericaChileChinaColombiaCongoCosta RicaCroatiaCubaCzechoslovakiaDenmarkDominicaDominican RepublicEastern AfricaEastern AsiaEastern EuropeEcuadorEgyptEl SalvadorEnglandEritreaEthiopiaEuropeFijiFranceGermanyGhanaGreeceGrenadaGuatemalaGuyanaHaitiHondurasHong KongHungaryIndiaIndonesiaIranIraqIrelandIsraelItalyJamaicaJapanJordanKazakhstanKenyaKoreaKuwaitLaosLatin AmericaLatviaLebanonLiberiaLithuaniaMalaysiaMexicoMicronesiaMiddle AfricaMoldovaMoroccoNepalNetherlandsNicaraguaNigeriaNorth AmericaNorth MacedoniaNorthern AfricaNorthern EuropeNorwayOceaniaPakistanPanamaPeruPhilippinesPolandPortugalRomaniaRussiaSaudi ArabiaScotlandSenegalSerbiaSierra LeoneSingaporeSomaliaSouth AfricaSouth AmericaSouth Central AsiaSouth Eastern AsiaSouthern EuropeSpainSri LankaSt. Vincent and the GrenadinesSudanSwedenSwitzerlandSyriaTaiwanThailandTrinidad and TobagoTurkeyUgandaUkraineUruguayUzbekistanVenezuelaVietnamWest IndiesWestern AfricaWestern AsiaWestern EuropeYemenZaireZimbabweAzores
Unemployment Among Women with Children Under 6 years
Income
Poverty
Unemployment
Labor Participation
Family Structure
Vehicle Availability
Education Level
Disability

Unemployment Among Women with Children Under 6 years Comparison

Shoshone

Arabs

Tragic
Tragic
13.2%
UNEMPLOYMENT AMONG WOMEN WITH CHILDREN UNDER 6 YEARS
0.0/ 100
METRIC RATING
336th/ 347
METRIC RANK
7.9%
UNEMPLOYMENT AMONG WOMEN WITH CHILDREN UNDER 6 YEARS
9.4/ 100
METRIC RATING
219th/ 347
METRIC RANK

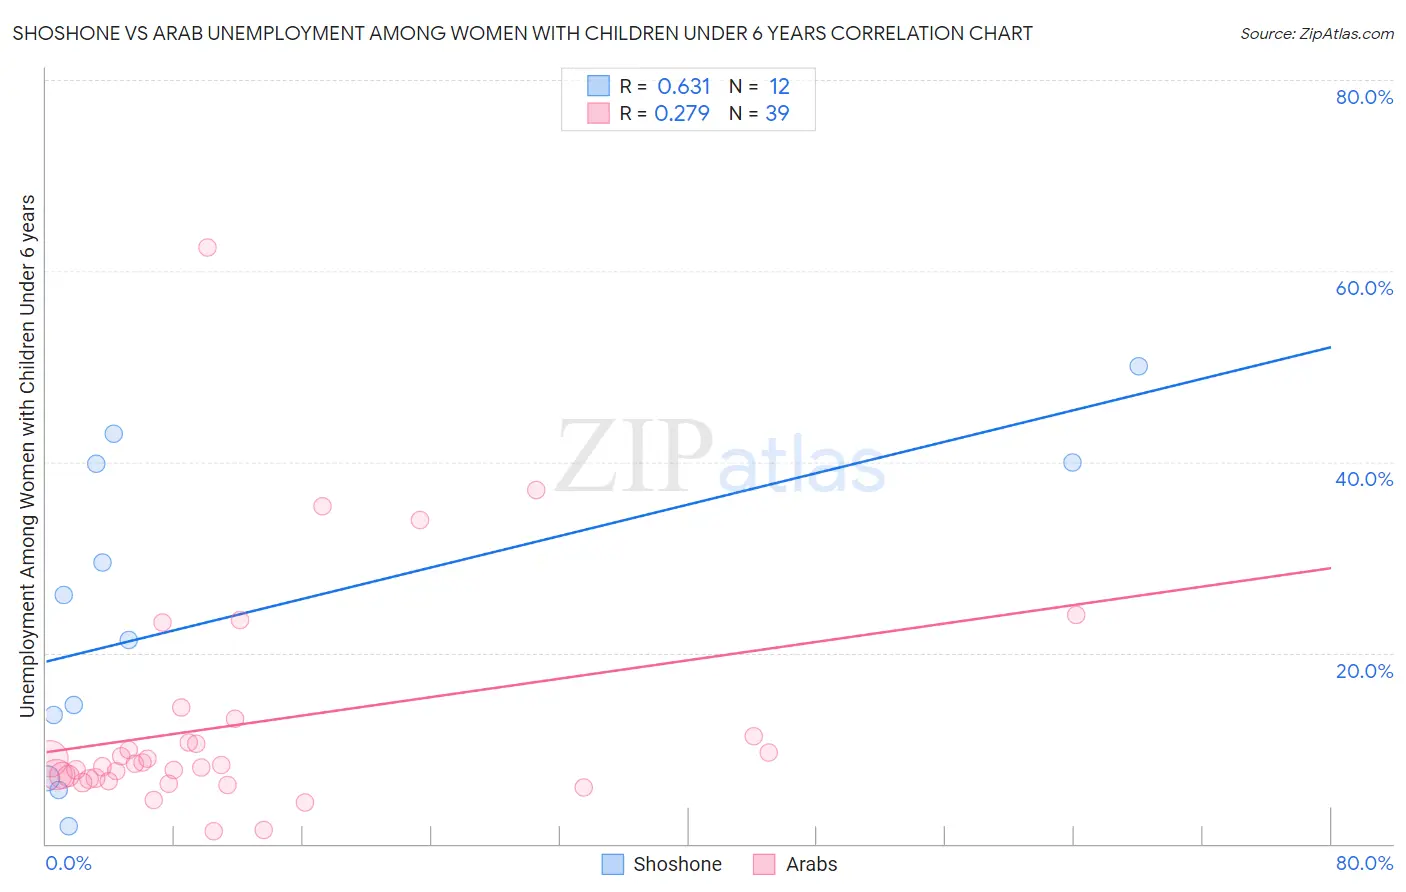
Shoshone vs Arab Unemployment Among Women with Children Under 6 years Correlation Chart

The statistical analysis conducted on geographies consisting of 60,930,865 people shows a significant positive correlation between the proportion of Shoshone and unemployment rate among women with children under the age of 6 in the United States with a correlation coefficient (R) of 0.631 and weighted average of 13.2%. Similarly, the statistical analysis conducted on geographies consisting of 351,431,027 people shows a weak positive correlation between the proportion of Arabs and unemployment rate among women with children under the age of 6 in the United States with a correlation coefficient (R) of 0.279 and weighted average of 7.9%, a difference of 66.2%.
Shoshone vs Arab Unemployment Among Women with Children Under 6 years

Unemployment Among Women with Children Under 6 years Correlation Summary

MeasurementShoshoneArab
Minimum1.9%1.3%
Maximum50.0%62.5%
Range48.1%61.2%
Mean24.3%12.5%
Median23.8%8.3%
Interquartile 25% (IQ1)10.1%6.8%
Interquartile 75% (IQ3)39.9%11.3%
Interquartile Range (IQR)29.8%4.5%
Standard Deviation (Sample)16.2%11.9%
Standard Deviation (Population)15.5%11.8%

Similar Demographics by Unemployment Among Women with Children Under 6 years

Demographics Similar to Shoshone by Unemployment Among Women with Children Under 6 years

In terms of unemployment among women with children under 6 years, the demographic groups most similar to Shoshone are Chippewa (13.3%, a difference of 1.1%), Pima (13.4%, a difference of 1.9%), Navajo (13.5%, a difference of 2.3%), Immigrants from Yemen (13.5%, a difference of 2.3%), and Lumbee (13.8%, a difference of 4.6%).
DemographicsRating | RankUnemployment Among Women with Children Under 6 years
Blacks/African Americans
0.0
/100
|
#329
Tragic
10.3%
Pennsylvania Germans
0.0
/100
|
#330
Tragic
10.8%
Colville
0.0
/100
|
#331
Tragic
11.2%
Sioux
0.0
/100
|
#332
Tragic
11.5%
Natives/Alaskans
0.0
/100
|
#333
Tragic
11.5%
Apache
0.0
/100
|
#334
Tragic
12.3%
Puerto Ricans
0.0
/100
|
#335
Tragic
12.5%
Shoshone
0.0
/100
|
#336
Tragic
13.2%
Chippewa
0.0
/100
|
#337
Tragic
13.3%
Pima
0.0
/100
|
#338
Tragic
13.4%
Navajo
0.0
/100
|
#339
Tragic
13.5%
Immigrants | Yemen
0.0
/100
|
#340
Tragic
13.5%
Lumbee
0.0
/100
|
#341
Tragic
13.8%
Yuman
0.0
/100
|
#342
Tragic
14.6%
Crow
0.0
/100
|
#343
Tragic
14.6%

Demographics Similar to Arabs by Unemployment Among Women with Children Under 6 years

In terms of unemployment among women with children under 6 years, the demographic groups most similar to Arabs are South American Indian (7.9%, a difference of 0.020%), Moroccan (7.9%, a difference of 0.070%), Immigrants from Germany (7.9%, a difference of 0.17%), Immigrants from Nigeria (7.9%, a difference of 0.18%), and Samoan (7.9%, a difference of 0.19%).
DemographicsRating | RankUnemployment Among Women with Children Under 6 years
Swiss
12.3
/100
|
#212
Poor
7.9%
Scottish
11.4
/100
|
#213
Poor
7.9%
Spanish
11.3
/100
|
#214
Poor
7.9%
Ecuadorians
11.2
/100
|
#215
Poor
7.9%
Immigrants | Lebanon
11.1
/100
|
#216
Poor
7.9%
Immigrants | Nigeria
10.3
/100
|
#217
Poor
7.9%
Moroccans
9.7
/100
|
#218
Tragic
7.9%
Arabs
9.4
/100
|
#219
Tragic
7.9%
South American Indians
9.3
/100
|
#220
Tragic
7.9%
Immigrants | Germany
8.5
/100
|
#221
Tragic
7.9%
Samoans
8.4
/100
|
#222
Tragic
7.9%
Carpatho Rusyns
7.8
/100
|
#223
Tragic
8.0%
English
7.2
/100
|
#224
Tragic
8.0%
Germans
7.0
/100
|
#225
Tragic
8.0%
Senegalese
6.2
/100
|
#226
Tragic
8.0%