Serbian vs Trinidadian and Tobagonian Unemployment
COMPARE
Serbian
Trinidadian and Tobagonian
Unemployment
Unemployment Comparison
Serbians
Trinidadians and Tobagonians
4.9%
UNEMPLOYMENT
98.4/ 100
METRIC RATING
70th/ 347
METRIC RANK
6.3%
UNEMPLOYMENT
0.0/ 100
METRIC RATING
301st/ 347
METRIC RANK
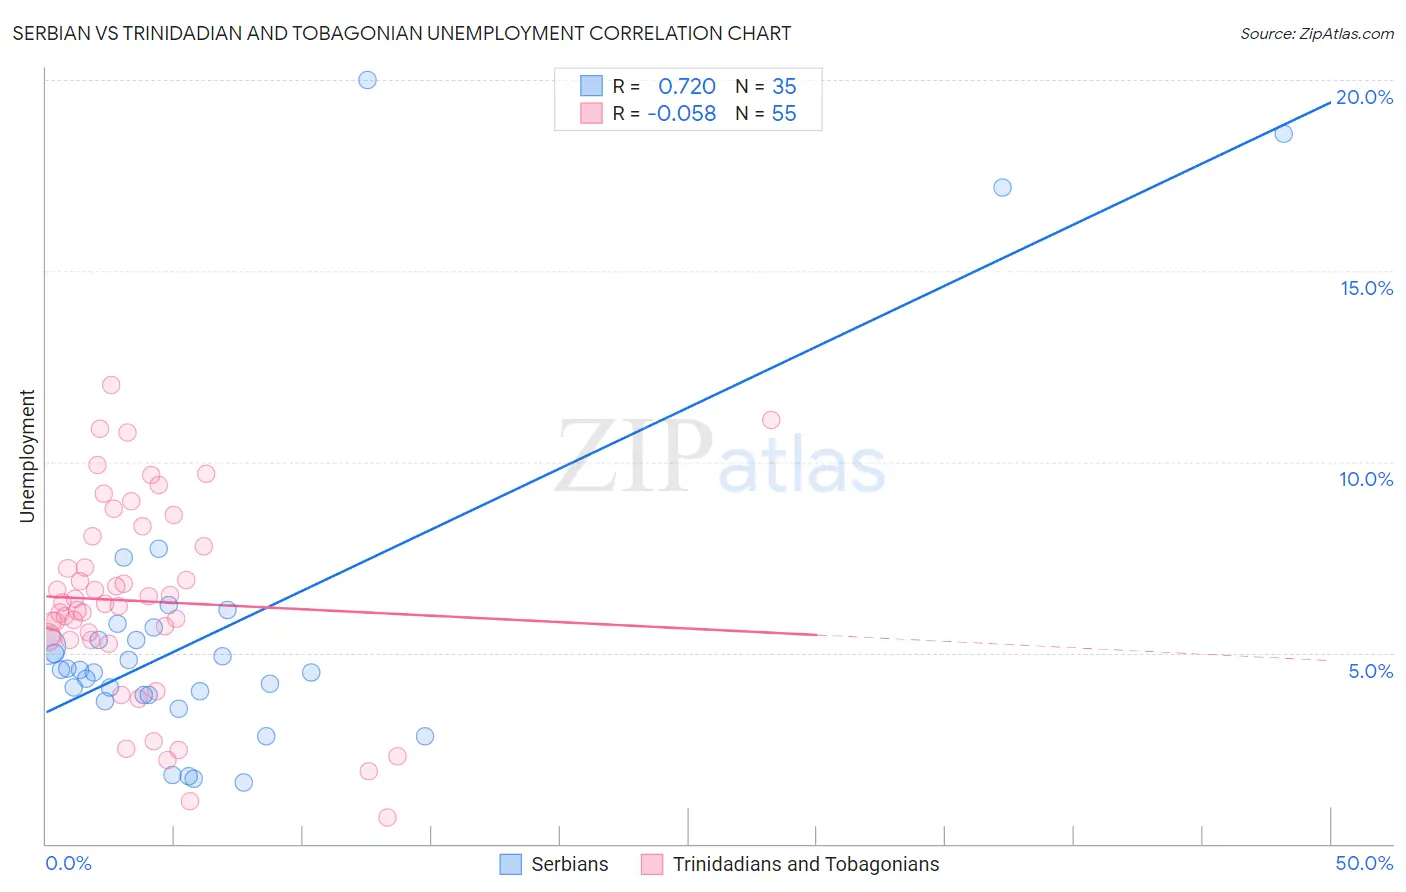
Serbian vs Trinidadian and Tobagonian Unemployment Correlation Chart
The statistical analysis conducted on geographies consisting of 267,457,297 people shows a strong positive correlation between the proportion of Serbians and unemployment in the United States with a correlation coefficient (R) of 0.720 and weighted average of 4.9%. Similarly, the statistical analysis conducted on geographies consisting of 219,752,630 people shows a slight negative correlation between the proportion of Trinidadians and Tobagonians and unemployment in the United States with a correlation coefficient (R) of -0.058 and weighted average of 6.3%, a difference of 28.8%.
Unemployment Correlation Summary
| Measurement | Serbian | Trinidadian and Tobagonian |
| Minimum | 1.6% | 0.70% |
| Maximum | 20.0% | 12.0% |
| Range | 18.4% | 11.3% |
| Mean | 5.6% | 6.4% |
| Median | 4.6% | 6.3% |
| Interquartile 25% (IQ1) | 3.9% | 5.3% |
| Interquartile 75% (IQ3) | 5.7% | 8.1% |
| Interquartile Range (IQR) | 1.8% | 2.7% |
| Standard Deviation (Sample) | 4.3% | 2.6% |
| Standard Deviation (Population) | 4.2% | 2.6% |
Similar Demographics by Unemployment
Demographics Similar to Serbians by Unemployment
In terms of unemployment, the demographic groups most similar to Serbians are Immigrants from Japan (4.9%, a difference of 0.050%), Burmese (4.9%, a difference of 0.080%), Paraguayan (4.9%, a difference of 0.12%), Immigrants from North America (4.9%, a difference of 0.15%), and Immigrants from Northern Europe (4.9%, a difference of 0.21%).
| Demographics | Rating | Rank | Unemployment |
| Immigrants | Bulgaria | 98.9 /100 | #63 | Exceptional 4.9% |
| Italians | 98.9 /100 | #64 | Exceptional 4.9% |
| Immigrants | Canada | 98.8 /100 | #65 | Exceptional 4.9% |
| Slovaks | 98.7 /100 | #66 | Exceptional 4.9% |
| New Zealanders | 98.6 /100 | #67 | Exceptional 4.9% |
| Slavs | 98.6 /100 | #68 | Exceptional 4.9% |
| Immigrants | North America | 98.5 /100 | #69 | Exceptional 4.9% |
| Serbians | 98.4 /100 | #70 | Exceptional 4.9% |
| Immigrants | Japan | 98.3 /100 | #71 | Exceptional 4.9% |
| Burmese | 98.3 /100 | #72 | Exceptional 4.9% |
| Paraguayans | 98.3 /100 | #73 | Exceptional 4.9% |
| Immigrants | Northern Europe | 98.2 /100 | #74 | Exceptional 4.9% |
| Turks | 98.0 /100 | #75 | Exceptional 4.9% |
| German Russians | 98.0 /100 | #76 | Exceptional 4.9% |
| Cypriots | 97.9 /100 | #77 | Exceptional 4.9% |
Demographics Similar to Trinidadians and Tobagonians by Unemployment
In terms of unemployment, the demographic groups most similar to Trinidadians and Tobagonians are West Indian (6.4%, a difference of 0.25%), Immigrants from Trinidad and Tobago (6.3%, a difference of 0.48%), Belizean (6.4%, a difference of 0.48%), Immigrants from West Indies (6.3%, a difference of 0.60%), and Immigrants from Haiti (6.3%, a difference of 0.65%).
| Demographics | Rating | Rank | Unemployment |
| Spanish American Indians | 0.0 /100 | #294 | Tragic 6.2% |
| U.S. Virgin Islanders | 0.0 /100 | #295 | Tragic 6.3% |
| Ute | 0.0 /100 | #296 | Tragic 6.3% |
| Jamaicans | 0.0 /100 | #297 | Tragic 6.3% |
| Immigrants | Haiti | 0.0 /100 | #298 | Tragic 6.3% |
| Immigrants | West Indies | 0.0 /100 | #299 | Tragic 6.3% |
| Immigrants | Trinidad and Tobago | 0.0 /100 | #300 | Tragic 6.3% |
| Trinidadians and Tobagonians | 0.0 /100 | #301 | Tragic 6.3% |
| West Indians | 0.0 /100 | #302 | Tragic 6.4% |
| Belizeans | 0.0 /100 | #303 | Tragic 6.4% |
| Immigrants | Jamaica | 0.0 /100 | #304 | Tragic 6.4% |
| Menominee | 0.0 /100 | #305 | Tragic 6.4% |
| Lumbee | 0.0 /100 | #306 | Tragic 6.4% |
| Immigrants | Bangladesh | 0.0 /100 | #307 | Tragic 6.5% |
| Barbadians | 0.0 /100 | #308 | Tragic 6.5% |