Serbian vs Central American Unemployment Among Ages 25 to 29 years

COMPARE

Serbian
Race
Ancestry
AfghanAfricanAlaska NativeAlaskan AthabascanAlbanianAleutAlsatianAmericanApacheArabArapahoArgentineanArmenianAssyrian/Chaldean/SyriacAustralianAustrianBahamianBangladeshiBarbadianBasqueBelgianBelizeanBermudanBhutaneseBlackfeetBolivianBrazilianBritishBritish West IndianBulgarianBurmeseCajunCambodianCanadianCape VerdeanCarpatho RusynCelticCentral American IndianCherokeeCheyenneChickasawChileanChineseChippewaChoctawColombianColvilleComancheCosta RicanCreeCreekCroatianCrowCubanCypriotCzechCzechoslovakianDanishDelawareDominicanDutchDutch West IndianEastern EuropeanEcuadorianEgyptianEnglishEstonianEthiopianEuropeanFijianFilipinoFinnishFrenchFrench American IndianFrench CanadianGermanGerman RussianGhanaianGreekGuamanian/ChamorroGuatemalanGuyaneseHaitianHmongHonduranHopiHoumaHungarianIcelanderIndian (Asian)IndonesianInupiatIranianIraqiIrishIroquoisIsraeliItalianJamaicanJapaneseJordanianKenyanKiowaKoreanLaotianLatvianLebaneseLiberianLithuanianLumbeeLuxembourgerMacedonianMalaysianMalteseMarshalleseMenomineeMexicanMexican American IndianMongolianMoroccanNative HawaiianNavajoNepaleseNew ZealanderNicaraguanNigerianNorthern EuropeanNorwegianOkinawanOsageOttawaPaiutePakistaniPalestinianPanamanianParaguayanPennsylvania GermanPeruvianPimaPolishPortuguesePotawatomiPuebloPuerto RicanPuget Sound SalishRomanianRussianSalvadoranSamoanScandinavianScotch-IrishScottishSeminoleSenegaleseSerbianShoshoneSierra LeoneanSiouxSlavicSlovakSloveneSomaliSouth AfricanSouth AmericanSouth American IndianSoviet UnionSpaniardSpanishSpanish AmericanSpanish American IndianSri LankanSubsaharan AfricanSudaneseSwedishSwissSyrianTaiwaneseThaiTlingit-HaidaTohono O'OdhamTonganTrinidadian and TobagonianTsimshianTurkishU.S. Virgin IslanderUgandanUkrainianUruguayanUteVenezuelanVietnameseWelshWest IndianYakamaYaquiYugoslavianYumanYup'ikZimbabwean
Immigration
NonimmigrantsImmigrantsAfghanistanAfricaAlbaniaArgentinaArmeniaAsiaAustraliaAustriaBahamasBangladeshBarbadosBelarusBelgiumBelizeBoliviaBosnia and HerzegovinaBrazilBulgariaBurma/MyanmarCabo VerdeCambodiaCameroonCanadaCaribbeanCentral AmericaChileChinaColombiaCongoCosta RicaCroatiaCubaCzechoslovakiaDenmarkDominicaDominican RepublicEastern AfricaEastern AsiaEastern EuropeEcuadorEgyptEl SalvadorEnglandEritreaEthiopiaEuropeFijiFranceGermanyGhanaGreeceGrenadaGuatemalaGuyanaHaitiHondurasHong KongHungaryIndiaIndonesiaIranIraqIrelandIsraelItalyJamaicaJapanJordanKazakhstanKenyaKoreaKuwaitLaosLatin AmericaLatviaLebanonLiberiaLithuaniaMalaysiaMexicoMicronesiaMiddle AfricaMoldovaMoroccoNepalNetherlandsNicaraguaNigeriaNorth AmericaNorth MacedoniaNorthern AfricaNorthern EuropeNorwayOceaniaPakistanPanamaPeruPhilippinesPolandPortugalRomaniaRussiaSaudi ArabiaScotlandSenegalSerbiaSierra LeoneSingaporeSomaliaSouth AfricaSouth AmericaSouth Central AsiaSouth Eastern AsiaSouthern EuropeSpainSri LankaSt. Vincent and the GrenadinesSudanSwedenSwitzerlandSyriaTaiwanThailandTrinidad and TobagoTurkeyUgandaUkraineUruguayUzbekistanVenezuelaVietnamWest IndiesWestern AfricaWestern AsiaWestern EuropeYemenZaireZimbabweAzores
Central American
Race
Ancestry
AfghanAfricanAlaska NativeAlaskan AthabascanAlbanianAleutAlsatianAmericanApacheArabArapahoArgentineanArmenianAssyrian/Chaldean/SyriacAustralianAustrianBahamianBangladeshiBarbadianBasqueBelgianBelizeanBermudanBhutaneseBlackfeetBolivianBrazilianBritishBritish West IndianBulgarianBurmeseCajunCambodianCanadianCape VerdeanCarpatho RusynCelticCentral AmericanCentral American IndianCherokeeCheyenneChickasawChileanChineseChippewaChoctawColombianColvilleComancheCosta RicanCreeCreekCroatianCrowCubanCypriotCzechCzechoslovakianDanishDelawareDominicanDutchDutch West IndianEastern EuropeanEcuadorianEgyptianEnglishEstonianEthiopianEuropeanFijianFilipinoFinnishFrenchFrench American IndianFrench CanadianGermanGerman RussianGhanaianGreekGuamanian/ChamorroGuatemalanGuyaneseHaitianHmongHonduranHopiHoumaHungarianIcelanderIndian (Asian)IndonesianInupiatIranianIraqiIrishIroquoisIsraeliItalianJamaicanJapaneseJordanianKenyanKiowaKoreanLaotianLatvianLebaneseLiberianLithuanianLumbeeLuxembourgerMacedonianMalaysianMalteseMarshalleseMenomineeMexicanMexican American IndianMongolianMoroccanNative HawaiianNavajoNepaleseNew ZealanderNicaraguanNigerianNorthern EuropeanNorwegianOkinawanOsageOttawaPaiutePakistaniPalestinianPanamanianParaguayanPennsylvania GermanPeruvianPimaPolishPortuguesePotawatomiPuebloPuerto RicanPuget Sound SalishRomanianRussianSalvadoranSamoanScandinavianScotch-IrishScottishSeminoleSenegaleseShoshoneSierra LeoneanSiouxSlavicSlovakSloveneSomaliSouth AfricanSouth AmericanSouth American IndianSoviet UnionSpaniardSpanishSpanish AmericanSpanish American IndianSri LankanSubsaharan AfricanSudaneseSwedishSwissSyrianTaiwaneseThaiTlingit-HaidaTohono O'OdhamTonganTrinidadian and TobagonianTsimshianTurkishU.S. Virgin IslanderUgandanUkrainianUruguayanUteVenezuelanVietnameseWelshWest IndianYakamaYaquiYugoslavianYumanYup'ikZimbabwean
Immigration
NonimmigrantsImmigrantsAfghanistanAfricaAlbaniaArgentinaArmeniaAsiaAustraliaAustriaBahamasBangladeshBarbadosBelarusBelgiumBelizeBoliviaBosnia and HerzegovinaBrazilBulgariaBurma/MyanmarCabo VerdeCambodiaCameroonCanadaCaribbeanCentral AmericaChileChinaColombiaCongoCosta RicaCroatiaCubaCzechoslovakiaDenmarkDominicaDominican RepublicEastern AfricaEastern AsiaEastern EuropeEcuadorEgyptEl SalvadorEnglandEritreaEthiopiaEuropeFijiFranceGermanyGhanaGreeceGrenadaGuatemalaGuyanaHaitiHondurasHong KongHungaryIndiaIndonesiaIranIraqIrelandIsraelItalyJamaicaJapanJordanKazakhstanKenyaKoreaKuwaitLaosLatin AmericaLatviaLebanonLiberiaLithuaniaMalaysiaMexicoMicronesiaMiddle AfricaMoldovaMoroccoNepalNetherlandsNicaraguaNigeriaNorth AmericaNorth MacedoniaNorthern AfricaNorthern EuropeNorwayOceaniaPakistanPanamaPeruPhilippinesPolandPortugalRomaniaRussiaSaudi ArabiaScotlandSenegalSerbiaSierra LeoneSingaporeSomaliaSouth AfricaSouth AmericaSouth Central AsiaSouth Eastern AsiaSouthern EuropeSpainSri LankaSt. Vincent and the GrenadinesSudanSwedenSwitzerlandSyriaTaiwanThailandTrinidad and TobagoTurkeyUgandaUkraineUruguayUzbekistanVenezuelaVietnamWest IndiesWestern AfricaWestern AsiaWestern EuropeYemenZaireZimbabweAzores
Unemployment Among Ages 25 to 29 years
Income
Poverty
Unemployment
Labor Participation
Family Structure
Vehicle Availability
Education Level
Disability

Unemployment Among Ages 25 to 29 years Comparison

Serbians

Central Americans

Exceptional
Tragic
6.4%
UNEMPLOYMENT AMONG AGES 25 TO 29 YEARS
91.7/ 100
METRIC RATING
98th/ 347
METRIC RANK
7.0%
UNEMPLOYMENT AMONG AGES 25 TO 29 YEARS
3.0/ 100
METRIC RATING
231st/ 347
METRIC RANK

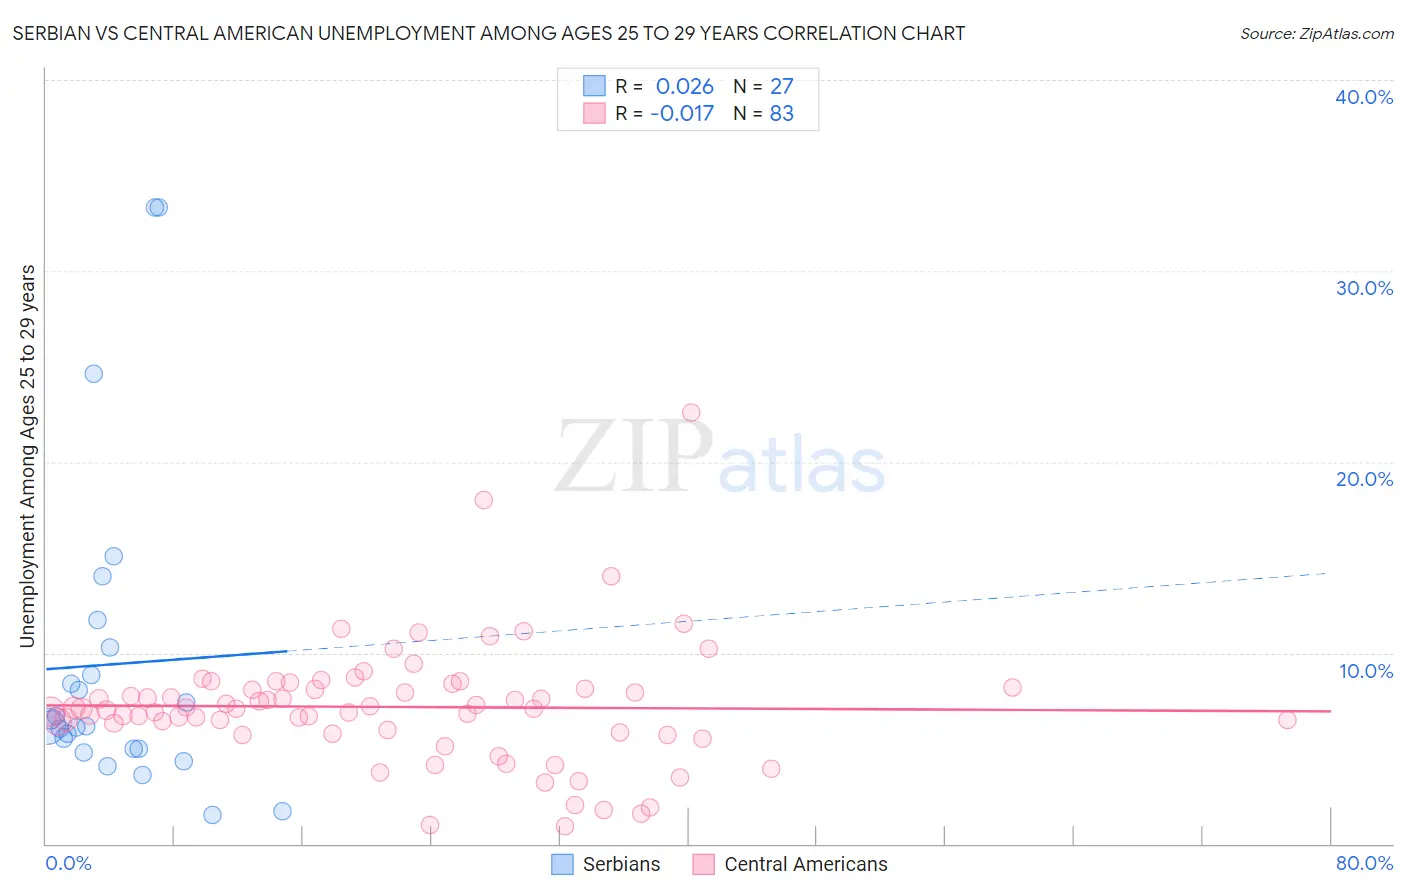
Serbian vs Central American Unemployment Among Ages 25 to 29 years Correlation Chart

The statistical analysis conducted on geographies consisting of 256,984,110 people shows no correlation between the proportion of Serbians and unemployment rate among population between the ages 25 and 29 in the United States with a correlation coefficient (R) of 0.026 and weighted average of 6.4%. Similarly, the statistical analysis conducted on geographies consisting of 469,203,667 people shows no correlation between the proportion of Central Americans and unemployment rate among population between the ages 25 and 29 in the United States with a correlation coefficient (R) of -0.017 and weighted average of 7.0%, a difference of 9.4%.
Serbian vs Central American Unemployment Among Ages 25 to 29 years

Unemployment Among Ages 25 to 29 years Correlation Summary

MeasurementSerbianCentral American
Minimum1.5%0.90%
Maximum33.3%22.6%
Range31.8%21.7%
Mean9.4%7.2%
Median6.2%7.1%
Interquartile 25% (IQ1)5.0%5.8%
Interquartile 75% (IQ3)10.3%8.2%
Interquartile Range (IQR)5.3%2.4%
Standard Deviation (Sample)8.3%3.2%
Standard Deviation (Population)8.2%3.2%

Similar Demographics by Unemployment Among Ages 25 to 29 years

Demographics Similar to Serbians by Unemployment Among Ages 25 to 29 years

In terms of unemployment among ages 25 to 29 years, the demographic groups most similar to Serbians are Immigrants from Eastern Europe (6.4%, a difference of 0.030%), Immigrants from Brazil (6.4%, a difference of 0.090%), Iraqi (6.4%, a difference of 0.090%), Uruguayan (6.4%, a difference of 0.11%), and Immigrants from Ireland (6.4%, a difference of 0.13%).
DemographicsRating | RankUnemployment Among Ages 25 to 29 years
Egyptians
93.9
/100
|
#91
Exceptional
6.4%
Immigrants | North Macedonia
93.6
/100
|
#92
Exceptional
6.4%
Australians
93.6
/100
|
#93
Exceptional
6.4%
Zimbabweans
93.5
/100
|
#94
Exceptional
6.4%
Afghans
92.5
/100
|
#95
Exceptional
6.4%
Immigrants | Brazil
92.1
/100
|
#96
Exceptional
6.4%
Immigrants | Eastern Europe
91.9
/100
|
#97
Exceptional
6.4%
Serbians
91.7
/100
|
#98
Exceptional
6.4%
Iraqis
91.3
/100
|
#99
Exceptional
6.4%
Uruguayans
91.2
/100
|
#100
Exceptional
6.4%
Immigrants | Ireland
91.1
/100
|
#101
Exceptional
6.4%
British
90.5
/100
|
#102
Exceptional
6.4%
Immigrants | Congo
90.4
/100
|
#103
Exceptional
6.4%
Cypriots
90.1
/100
|
#104
Exceptional
6.4%
Immigrants | Kazakhstan
89.8
/100
|
#105
Excellent
6.4%

Demographics Similar to Central Americans by Unemployment Among Ages 25 to 29 years

In terms of unemployment among ages 25 to 29 years, the demographic groups most similar to Central Americans are Spanish American (7.0%, a difference of 0.15%), Immigrants from El Salvador (7.0%, a difference of 0.29%), Immigrants from Honduras (7.0%, a difference of 0.34%), French Canadian (7.0%, a difference of 0.36%), and Bermudan (7.0%, a difference of 0.37%).
DemographicsRating | RankUnemployment Among Ages 25 to 29 years
Immigrants | Immigrants
6.2
/100
|
#224
Tragic
6.9%
Japanese
5.4
/100
|
#225
Tragic
6.9%
Immigrants | Liberia
4.8
/100
|
#226
Tragic
7.0%
Salvadorans
4.4
/100
|
#227
Tragic
7.0%
Immigrants | Panama
4.2
/100
|
#228
Tragic
7.0%
Bermudans
3.8
/100
|
#229
Tragic
7.0%
Immigrants | El Salvador
3.6
/100
|
#230
Tragic
7.0%
Central Americans
3.0
/100
|
#231
Tragic
7.0%
Spanish Americans
2.7
/100
|
#232
Tragic
7.0%
Immigrants | Honduras
2.4
/100
|
#233
Tragic
7.0%
French Canadians
2.4
/100
|
#234
Tragic
7.0%
Panamanians
2.1
/100
|
#235
Tragic
7.0%
Cape Verdeans
1.9
/100
|
#236
Tragic
7.0%
Puget Sound Salish
1.8
/100
|
#237
Tragic
7.1%
Hondurans
1.8
/100
|
#238
Tragic
7.1%