Scottish vs Immigrants from Senegal Female Unemployment

COMPARE

Scottish
Race
Ancestry
AfghanAfricanAlaska NativeAlaskan AthabascanAlbanianAleutAlsatianAmericanApacheArabArapahoArgentineanArmenianAssyrian/Chaldean/SyriacAustralianAustrianBahamianBangladeshiBarbadianBasqueBelgianBelizeanBermudanBhutaneseBlackfeetBolivianBrazilianBritishBritish West IndianBulgarianBurmeseCajunCambodianCanadianCape VerdeanCarpatho RusynCelticCentral AmericanCentral American IndianCherokeeCheyenneChickasawChileanChineseChippewaChoctawColombianColvilleComancheCosta RicanCreeCreekCroatianCrowCubanCypriotCzechCzechoslovakianDanishDelawareDominicanDutchDutch West IndianEastern EuropeanEcuadorianEgyptianEnglishEstonianEthiopianEuropeanFijianFilipinoFinnishFrenchFrench American IndianFrench CanadianGermanGerman RussianGhanaianGreekGuamanian/ChamorroGuatemalanGuyaneseHaitianHmongHonduranHopiHoumaHungarianIcelanderIndian (Asian)IndonesianInupiatIranianIraqiIrishIroquoisIsraeliItalianJamaicanJapaneseJordanianKenyanKiowaKoreanLaotianLatvianLebaneseLiberianLithuanianLumbeeLuxembourgerMacedonianMalaysianMalteseMarshalleseMenomineeMexicanMexican American IndianMongolianMoroccanNative HawaiianNavajoNepaleseNew ZealanderNicaraguanNigerianNorthern EuropeanNorwegianOkinawanOsageOttawaPaiutePakistaniPalestinianPanamanianParaguayanPennsylvania GermanPeruvianPimaPolishPortuguesePotawatomiPuebloPuerto RicanPuget Sound SalishRomanianRussianSalvadoranSamoanScandinavianScotch-IrishScottishSeminoleSenegaleseSerbianShoshoneSierra LeoneanSiouxSlavicSlovakSloveneSomaliSouth AfricanSouth AmericanSouth American IndianSoviet UnionSpaniardSpanishSpanish AmericanSpanish American IndianSri LankanSubsaharan AfricanSudaneseSwedishSwissSyrianTaiwaneseThaiTlingit-HaidaTohono O'OdhamTonganTrinidadian and TobagonianTsimshianTurkishU.S. Virgin IslanderUgandanUkrainianUruguayanUteVenezuelanVietnameseWelshWest IndianYakamaYaquiYugoslavianYumanYup'ikZimbabwean
Immigration
NonimmigrantsImmigrantsAfghanistanAfricaAlbaniaArgentinaArmeniaAsiaAustraliaAustriaBahamasBangladeshBarbadosBelarusBelgiumBelizeBoliviaBosnia and HerzegovinaBrazilBulgariaBurma/MyanmarCabo VerdeCambodiaCameroonCanadaCaribbeanCentral AmericaChileChinaColombiaCongoCosta RicaCroatiaCubaCzechoslovakiaDenmarkDominicaDominican RepublicEastern AfricaEastern AsiaEastern EuropeEcuadorEgyptEl SalvadorEnglandEritreaEthiopiaEuropeFijiFranceGermanyGhanaGreeceGrenadaGuatemalaGuyanaHaitiHondurasHong KongHungaryIndiaIndonesiaIranIraqIrelandIsraelItalyJamaicaJapanJordanKazakhstanKenyaKoreaKuwaitLaosLatin AmericaLatviaLebanonLiberiaLithuaniaMalaysiaMexicoMicronesiaMiddle AfricaMoldovaMoroccoNepalNetherlandsNicaraguaNigeriaNorth AmericaNorth MacedoniaNorthern AfricaNorthern EuropeNorwayOceaniaPakistanPanamaPeruPhilippinesPolandPortugalRomaniaRussiaSaudi ArabiaScotlandSerbiaSierra LeoneSingaporeSomaliaSouth AfricaSouth AmericaSouth Central AsiaSouth Eastern AsiaSouthern EuropeSpainSri LankaSt. Vincent and the GrenadinesSudanSwedenSwitzerlandSyriaTaiwanThailandTrinidad and TobagoTurkeyUgandaUkraineUruguayUzbekistanVenezuelaVietnamWest IndiesWestern AfricaWestern AsiaWestern EuropeYemenZaireZimbabweAzores
Immigrants from Senegal
Race
Ancestry
AfghanAfricanAlaska NativeAlaskan AthabascanAlbanianAleutAlsatianAmericanApacheArabArapahoArgentineanArmenianAssyrian/Chaldean/SyriacAustralianAustrianBahamianBangladeshiBarbadianBasqueBelgianBelizeanBermudanBhutaneseBlackfeetBolivianBrazilianBritishBritish West IndianBulgarianBurmeseCajunCambodianCanadianCape VerdeanCarpatho RusynCelticCentral AmericanCentral American IndianCherokeeCheyenneChickasawChileanChineseChippewaChoctawColombianColvilleComancheCosta RicanCreeCreekCroatianCrowCubanCypriotCzechCzechoslovakianDanishDelawareDominicanDutchDutch West IndianEastern EuropeanEcuadorianEgyptianEnglishEstonianEthiopianEuropeanFijianFilipinoFinnishFrenchFrench American IndianFrench CanadianGermanGerman RussianGhanaianGreekGuamanian/ChamorroGuatemalanGuyaneseHaitianHmongHonduranHopiHoumaHungarianIcelanderIndian (Asian)IndonesianInupiatIranianIraqiIrishIroquoisIsraeliItalianJamaicanJapaneseJordanianKenyanKiowaKoreanLaotianLatvianLebaneseLiberianLithuanianLumbeeLuxembourgerMacedonianMalaysianMalteseMarshalleseMenomineeMexicanMexican American IndianMongolianMoroccanNative HawaiianNavajoNepaleseNew ZealanderNicaraguanNigerianNorthern EuropeanNorwegianOkinawanOsageOttawaPaiutePakistaniPalestinianPanamanianParaguayanPennsylvania GermanPeruvianPimaPolishPortuguesePotawatomiPuebloPuerto RicanPuget Sound SalishRomanianRussianSalvadoranSamoanScandinavianScotch-IrishSeminoleSenegaleseSerbianShoshoneSierra LeoneanSiouxSlavicSlovakSloveneSomaliSouth AfricanSouth AmericanSouth American IndianSoviet UnionSpaniardSpanishSpanish AmericanSpanish American IndianSri LankanSubsaharan AfricanSudaneseSwedishSwissSyrianTaiwaneseThaiTlingit-HaidaTohono O'OdhamTonganTrinidadian and TobagonianTsimshianTurkishU.S. Virgin IslanderUgandanUkrainianUruguayanUteVenezuelanVietnameseWelshWest IndianYakamaYaquiYugoslavianYumanYup'ikZimbabwean
Immigration
NonimmigrantsImmigrantsAfghanistanAfricaAlbaniaArgentinaArmeniaAsiaAustraliaAustriaBahamasBangladeshBarbadosBelarusBelgiumBelizeBoliviaBosnia and HerzegovinaBrazilBulgariaBurma/MyanmarCabo VerdeCambodiaCameroonCanadaCaribbeanCentral AmericaChileChinaColombiaCongoCosta RicaCroatiaCubaCzechoslovakiaDenmarkDominicaDominican RepublicEastern AfricaEastern AsiaEastern EuropeEcuadorEgyptEl SalvadorEnglandEritreaEthiopiaEuropeFijiFranceGermanyGhanaGreeceGrenadaGuatemalaGuyanaHaitiHondurasHong KongHungaryIndiaIndonesiaIranIraqIrelandIsraelItalyJamaicaJapanJordanKazakhstanKenyaKoreaKuwaitLaosLatin AmericaLatviaLebanonLiberiaLithuaniaMalaysiaMexicoMicronesiaMiddle AfricaMoldovaMoroccoNepalNetherlandsNicaraguaNigeriaNorth AmericaNorth MacedoniaNorthern AfricaNorthern EuropeNorwayOceaniaPakistanPanamaPeruPhilippinesPolandPortugalRomaniaRussiaSaudi ArabiaScotlandSenegalSerbiaSierra LeoneSingaporeSomaliaSouth AfricaSouth AmericaSouth Central AsiaSouth Eastern AsiaSouthern EuropeSpainSri LankaSt. Vincent and the GrenadinesSudanSwedenSwitzerlandSyriaTaiwanThailandTrinidad and TobagoTurkeyUgandaUkraineUruguayUzbekistanVenezuelaVietnamWest IndiesWestern AfricaWestern AsiaWestern EuropeYemenZaireZimbabweAzores
Female Unemployment
Income
Poverty
Unemployment
Labor Participation
Family Structure
Vehicle Availability
Education Level
Disability

Female Unemployment Comparison

Scottish

Immigrants from Senegal

Exceptional
Tragic
4.7%
FEMALE UNEMPLOYMENT
99.9/ 100
METRIC RATING
23rd/ 347
METRIC RANK
6.1%
FEMALE UNEMPLOYMENT
0.0/ 100
METRIC RATING
284th/ 347
METRIC RANK

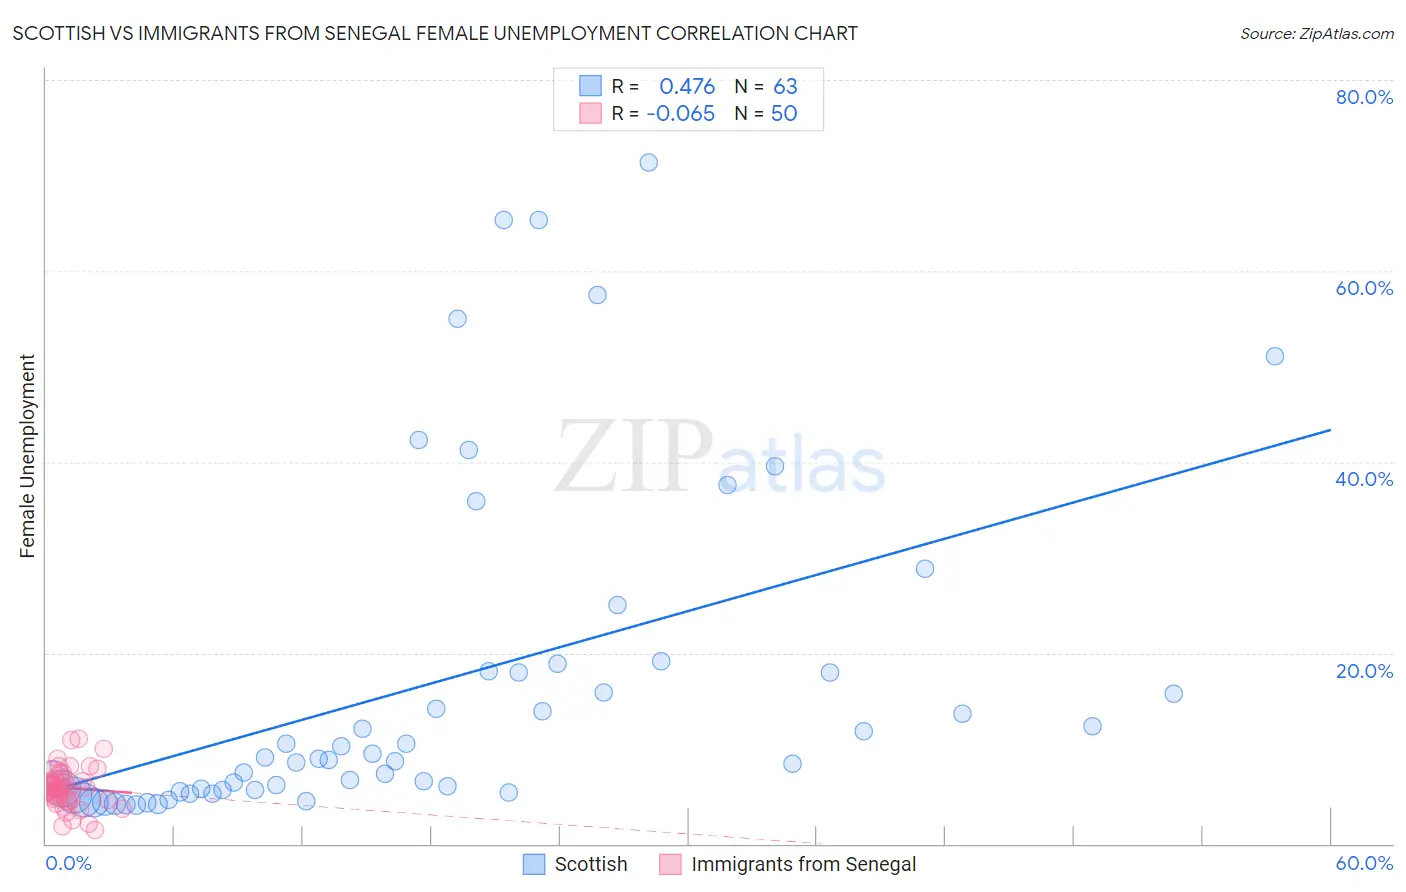
Scottish vs Immigrants from Senegal Female Unemployment Correlation Chart

The statistical analysis conducted on geographies consisting of 553,178,597 people shows a moderate positive correlation between the proportion of Scottish and unemploymnet rate among females in the United States with a correlation coefficient (R) of 0.476 and weighted average of 4.7%. Similarly, the statistical analysis conducted on geographies consisting of 90,121,254 people shows a slight negative correlation between the proportion of Immigrants from Senegal and unemploymnet rate among females in the United States with a correlation coefficient (R) of -0.065 and weighted average of 6.1%, a difference of 28.6%.
Scottish vs Immigrants from Senegal Female Unemployment

Female Unemployment Correlation Summary

MeasurementScottishImmigrants from Senegal
Minimum4.1%1.4%
Maximum71.4%11.0%
Range67.3%9.6%
Mean16.8%5.8%
Median8.9%5.9%
Interquartile 25% (IQ1)5.6%4.6%
Interquartile 75% (IQ3)18.0%6.8%
Interquartile Range (IQR)12.5%2.2%
Standard Deviation (Sample)17.5%2.0%
Standard Deviation (Population)17.4%2.0%

Similar Demographics by Female Unemployment

Demographics Similar to Scottish by Female Unemployment

In terms of female unemployment, the demographic groups most similar to Scottish are Welsh (4.7%, a difference of 0.21%), Immigrants from India (4.7%, a difference of 0.29%), Immigrants from Bosnia and Herzegovina (4.7%, a difference of 0.33%), British (4.7%, a difference of 0.50%), and Irish (4.7%, a difference of 0.53%).
DemographicsRating | RankFemale Unemployment
Carpatho Rusyns
99.9
/100
|
#16
Exceptional
4.7%
Croatians
99.9
/100
|
#17
Exceptional
4.7%
Latvians
99.9
/100
|
#18
Exceptional
4.7%
Poles
99.9
/100
|
#19
Exceptional
4.7%
Bulgarians
99.9
/100
|
#20
Exceptional
4.7%
Fijians
99.9
/100
|
#21
Exceptional
4.7%
Europeans
99.9
/100
|
#22
Exceptional
4.7%
Scottish
99.9
/100
|
#23
Exceptional
4.7%
Welsh
99.9
/100
|
#24
Exceptional
4.7%
Immigrants | India
99.9
/100
|
#25
Exceptional
4.7%
Immigrants | Bosnia and Herzegovina
99.9
/100
|
#26
Exceptional
4.7%
British
99.9
/100
|
#27
Exceptional
4.7%
Irish
99.9
/100
|
#28
Exceptional
4.7%
Cypriots
99.9
/100
|
#29
Exceptional
4.7%
Lithuanians
99.8
/100
|
#30
Exceptional
4.7%

Demographics Similar to Immigrants from Senegal by Female Unemployment

In terms of female unemployment, the demographic groups most similar to Immigrants from Senegal are Salvadoran (6.0%, a difference of 0.34%), Immigrants from Cabo Verde (6.1%, a difference of 0.38%), Chippewa (6.1%, a difference of 0.40%), Immigrants from Guatemala (6.1%, a difference of 0.43%), and Colville (6.0%, a difference of 0.44%).
DemographicsRating | RankFemale Unemployment
Immigrants | Ghana
0.0
/100
|
#277
Tragic
6.0%
Yaqui
0.0
/100
|
#278
Tragic
6.0%
Armenians
0.0
/100
|
#279
Tragic
6.0%
Mexican American Indians
0.0
/100
|
#280
Tragic
6.0%
Guatemalans
0.0
/100
|
#281
Tragic
6.0%
Colville
0.0
/100
|
#282
Tragic
6.0%
Salvadorans
0.0
/100
|
#283
Tragic
6.0%
Immigrants | Senegal
0.0
/100
|
#284
Tragic
6.1%
Immigrants | Cabo Verde
0.0
/100
|
#285
Tragic
6.1%
Chippewa
0.0
/100
|
#286
Tragic
6.1%
Immigrants | Guatemala
0.0
/100
|
#287
Tragic
6.1%
Haitians
0.0
/100
|
#288
Tragic
6.1%
Trinidadians and Tobagonians
0.0
/100
|
#289
Tragic
6.1%
Immigrants | Caribbean
0.0
/100
|
#290
Tragic
6.1%
Immigrants | West Indies
0.0
/100
|
#291
Tragic
6.1%