Salvadoran vs Immigrants from Norway Unemployment Among Women with Children Under 18 years

COMPARE

Salvadoran
Race
Ancestry
AfghanAfricanAlaska NativeAlaskan AthabascanAlbanianAleutAlsatianAmericanApacheArabArapahoArgentineanArmenianAssyrian/Chaldean/SyriacAustralianAustrianBahamianBangladeshiBarbadianBasqueBelgianBelizeanBermudanBhutaneseBlackfeetBolivianBrazilianBritishBritish West IndianBulgarianBurmeseCajunCambodianCanadianCape VerdeanCarpatho RusynCelticCentral AmericanCentral American IndianCherokeeCheyenneChickasawChileanChineseChippewaChoctawColombianColvilleComancheCosta RicanCreeCreekCroatianCrowCubanCypriotCzechCzechoslovakianDanishDelawareDominicanDutchDutch West IndianEastern EuropeanEcuadorianEgyptianEnglishEstonianEthiopianEuropeanFijianFilipinoFinnishFrenchFrench American IndianFrench CanadianGermanGerman RussianGhanaianGreekGuamanian/ChamorroGuatemalanGuyaneseHaitianHmongHonduranHopiHoumaHungarianIcelanderIndian (Asian)IndonesianInupiatIranianIraqiIrishIroquoisIsraeliItalianJamaicanJapaneseJordanianKenyanKiowaKoreanLaotianLatvianLebaneseLiberianLithuanianLumbeeLuxembourgerMacedonianMalaysianMalteseMarshalleseMenomineeMexicanMexican American IndianMongolianMoroccanNative HawaiianNavajoNepaleseNew ZealanderNicaraguanNigerianNorthern EuropeanNorwegianOkinawanOsageOttawaPaiutePakistaniPalestinianPanamanianParaguayanPennsylvania GermanPeruvianPimaPolishPortuguesePotawatomiPuebloPuerto RicanPuget Sound SalishRomanianRussianSalvadoranSamoanScandinavianScotch-IrishScottishSeminoleSenegaleseSerbianShoshoneSierra LeoneanSiouxSlavicSlovakSloveneSomaliSouth AfricanSouth AmericanSouth American IndianSoviet UnionSpaniardSpanishSpanish AmericanSpanish American IndianSri LankanSubsaharan AfricanSudaneseSwedishSwissSyrianTaiwaneseThaiTlingit-HaidaTohono O'OdhamTonganTrinidadian and TobagonianTsimshianTurkishU.S. Virgin IslanderUgandanUkrainianUruguayanUteVenezuelanVietnameseWelshWest IndianYakamaYaquiYugoslavianYumanYup'ikZimbabwean
Immigration
NonimmigrantsImmigrantsAfghanistanAfricaAlbaniaArgentinaArmeniaAsiaAustraliaAustriaBahamasBangladeshBarbadosBelarusBelgiumBelizeBoliviaBosnia and HerzegovinaBrazilBulgariaBurma/MyanmarCabo VerdeCambodiaCameroonCanadaCaribbeanCentral AmericaChileChinaColombiaCongoCosta RicaCroatiaCubaCzechoslovakiaDenmarkDominicaDominican RepublicEastern AfricaEastern AsiaEastern EuropeEcuadorEgyptEl SalvadorEnglandEritreaEthiopiaEuropeFijiFranceGermanyGhanaGreeceGrenadaGuatemalaGuyanaHaitiHondurasHong KongHungaryIndiaIndonesiaIranIraqIrelandIsraelItalyJamaicaJapanJordanKazakhstanKenyaKoreaKuwaitLaosLatin AmericaLatviaLebanonLiberiaLithuaniaMalaysiaMexicoMicronesiaMiddle AfricaMoldovaMoroccoNepalNetherlandsNicaraguaNigeriaNorth AmericaNorth MacedoniaNorthern AfricaNorthern EuropeOceaniaPakistanPanamaPeruPhilippinesPolandPortugalRomaniaRussiaSaudi ArabiaScotlandSenegalSerbiaSierra LeoneSingaporeSomaliaSouth AfricaSouth AmericaSouth Central AsiaSouth Eastern AsiaSouthern EuropeSpainSri LankaSt. Vincent and the GrenadinesSudanSwedenSwitzerlandSyriaTaiwanThailandTrinidad and TobagoTurkeyUgandaUkraineUruguayUzbekistanVenezuelaVietnamWest IndiesWestern AfricaWestern AsiaWestern EuropeYemenZaireZimbabweAzores
Immigrants from Norway
Race
Ancestry
AfghanAfricanAlaska NativeAlaskan AthabascanAlbanianAleutAlsatianAmericanApacheArabArapahoArgentineanArmenianAssyrian/Chaldean/SyriacAustralianAustrianBahamianBangladeshiBarbadianBasqueBelgianBelizeanBermudanBhutaneseBlackfeetBolivianBrazilianBritishBritish West IndianBulgarianBurmeseCajunCambodianCanadianCape VerdeanCarpatho RusynCelticCentral AmericanCentral American IndianCherokeeCheyenneChickasawChileanChineseChippewaChoctawColombianColvilleComancheCosta RicanCreeCreekCroatianCrowCubanCypriotCzechCzechoslovakianDanishDelawareDominicanDutchDutch West IndianEastern EuropeanEcuadorianEgyptianEnglishEstonianEthiopianEuropeanFijianFilipinoFinnishFrenchFrench American IndianFrench CanadianGermanGerman RussianGhanaianGreekGuamanian/ChamorroGuatemalanGuyaneseHaitianHmongHonduranHopiHoumaHungarianIcelanderIndian (Asian)IndonesianInupiatIranianIraqiIrishIroquoisIsraeliItalianJamaicanJapaneseJordanianKenyanKiowaKoreanLaotianLatvianLebaneseLiberianLithuanianLumbeeLuxembourgerMacedonianMalaysianMalteseMarshalleseMenomineeMexicanMexican American IndianMongolianMoroccanNative HawaiianNavajoNepaleseNew ZealanderNicaraguanNigerianNorthern EuropeanNorwegianOkinawanOsageOttawaPaiutePakistaniPalestinianPanamanianParaguayanPennsylvania GermanPeruvianPimaPolishPortuguesePotawatomiPuebloPuerto RicanPuget Sound SalishRomanianRussianSamoanScandinavianScotch-IrishScottishSeminoleSenegaleseSerbianShoshoneSierra LeoneanSiouxSlavicSlovakSloveneSomaliSouth AfricanSouth AmericanSouth American IndianSoviet UnionSpaniardSpanishSpanish AmericanSpanish American IndianSri LankanSubsaharan AfricanSudaneseSwedishSwissSyrianTaiwaneseThaiTlingit-HaidaTohono O'OdhamTonganTrinidadian and TobagonianTsimshianTurkishU.S. Virgin IslanderUgandanUkrainianUruguayanUteVenezuelanVietnameseWelshWest IndianYakamaYaquiYugoslavianYumanYup'ikZimbabwean
Immigration
NonimmigrantsImmigrantsAfghanistanAfricaAlbaniaArgentinaArmeniaAsiaAustraliaAustriaBahamasBangladeshBarbadosBelarusBelgiumBelizeBoliviaBosnia and HerzegovinaBrazilBulgariaBurma/MyanmarCabo VerdeCambodiaCameroonCanadaCaribbeanCentral AmericaChileChinaColombiaCongoCosta RicaCroatiaCubaCzechoslovakiaDenmarkDominicaDominican RepublicEastern AfricaEastern AsiaEastern EuropeEcuadorEgyptEl SalvadorEnglandEritreaEthiopiaEuropeFijiFranceGermanyGhanaGreeceGrenadaGuatemalaGuyanaHaitiHondurasHong KongHungaryIndiaIndonesiaIranIraqIrelandIsraelItalyJamaicaJapanJordanKazakhstanKenyaKoreaKuwaitLaosLatin AmericaLatviaLebanonLiberiaLithuaniaMalaysiaMexicoMicronesiaMiddle AfricaMoldovaMoroccoNepalNetherlandsNicaraguaNigeriaNorth AmericaNorth MacedoniaNorthern AfricaNorthern EuropeNorwayOceaniaPakistanPanamaPeruPhilippinesPolandPortugalRomaniaRussiaSaudi ArabiaScotlandSenegalSerbiaSierra LeoneSingaporeSomaliaSouth AfricaSouth AmericaSouth Central AsiaSouth Eastern AsiaSouthern EuropeSpainSri LankaSt. Vincent and the GrenadinesSudanSwedenSwitzerlandSyriaTaiwanThailandTrinidad and TobagoTurkeyUgandaUkraineUruguayUzbekistanVenezuelaVietnamWest IndiesWestern AfricaWestern AsiaWestern EuropeYemenZaireZimbabweAzores
Unemployment Among Women with Children Under 18 years
Income
Poverty
Unemployment
Labor Participation
Family Structure
Vehicle Availability
Education Level
Disability

Unemployment Among Women with Children Under 18 years Comparison

Salvadorans

Immigrants from Norway

Tragic
Good
6.2%
UNEMPLOYMENT AMONG WOMEN WITH CHILDREN UNDER 18 YEARS
0.0/ 100
METRIC RATING
272nd/ 347
METRIC RANK
5.3%
UNEMPLOYMENT AMONG WOMEN WITH CHILDREN UNDER 18 YEARS
76.2/ 100
METRIC RATING
140th/ 347
METRIC RANK

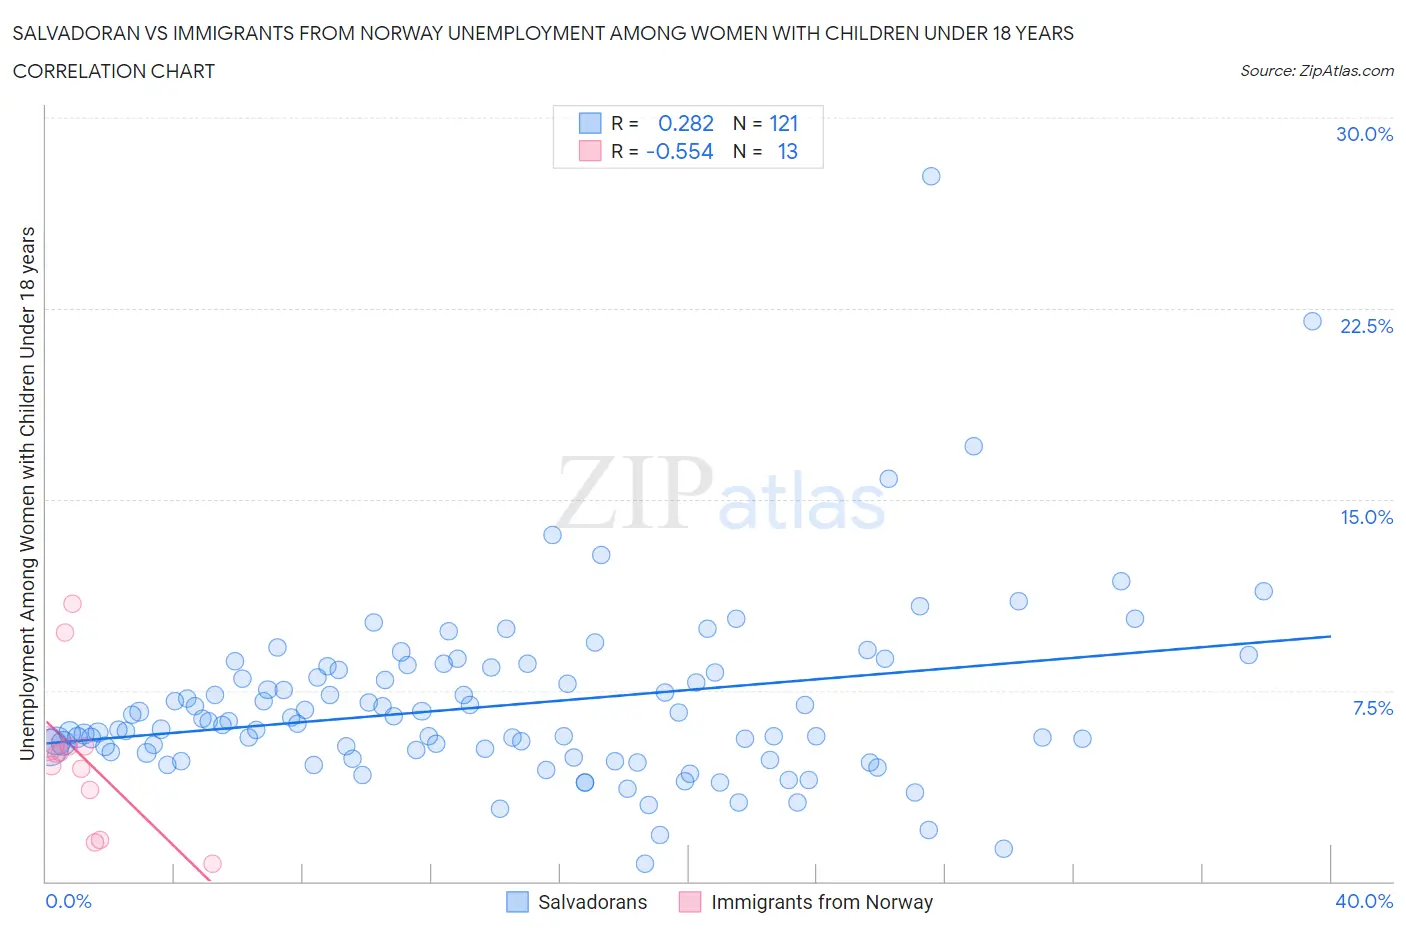
Salvadoran vs Immigrants from Norway Unemployment Among Women with Children Under 18 years Correlation Chart

The statistical analysis conducted on geographies consisting of 385,669,741 people shows a weak positive correlation between the proportion of Salvadorans and unemployment rate among women with children under the age of 18 in the United States with a correlation coefficient (R) of 0.282 and weighted average of 6.2%. Similarly, the statistical analysis conducted on geographies consisting of 114,528,417 people shows a substantial negative correlation between the proportion of Immigrants from Norway and unemployment rate among women with children under the age of 18 in the United States with a correlation coefficient (R) of -0.554 and weighted average of 5.3%, a difference of 16.4%.
Salvadoran vs Immigrants from Norway Unemployment Among Women with Children Under 18 years

Unemployment Among Women with Children Under 18 years Correlation Summary

MeasurementSalvadoranImmigrants from Norway
Minimum0.70%0.70%
Maximum27.7%10.9%
Range27.0%10.2%
Mean6.9%4.9%
Median6.2%5.0%
Interquartile 25% (IQ1)5.1%2.6%
Interquartile 75% (IQ3)8.3%5.4%
Interquartile Range (IQR)3.2%2.8%
Standard Deviation (Sample)3.5%2.9%
Standard Deviation (Population)3.5%2.8%

Similar Demographics by Unemployment Among Women with Children Under 18 years

Demographics Similar to Salvadorans by Unemployment Among Women with Children Under 18 years

In terms of unemployment among women with children under 18 years, the demographic groups most similar to Salvadorans are Immigrants from Western Africa (6.2%, a difference of 0.090%), Senegalese (6.2%, a difference of 0.10%), Central American (6.2%, a difference of 0.22%), Dutch West Indian (6.2%, a difference of 0.28%), and Immigrants from Ghana (6.2%, a difference of 0.39%).
DemographicsRating | RankUnemployment Among Women with Children Under 18 years
Immigrants | Bahamas
0.1
/100
|
#265
Tragic
6.1%
Sub-Saharan Africans
0.1
/100
|
#266
Tragic
6.2%
French American Indians
0.1
/100
|
#267
Tragic
6.2%
Trinidadians and Tobagonians
0.1
/100
|
#268
Tragic
6.2%
Cajuns
0.1
/100
|
#269
Tragic
6.2%
Ghanaians
0.1
/100
|
#270
Tragic
6.2%
Central Americans
0.0
/100
|
#271
Tragic
6.2%
Salvadorans
0.0
/100
|
#272
Tragic
6.2%
Immigrants | Western Africa
0.0
/100
|
#273
Tragic
6.2%
Senegalese
0.0
/100
|
#274
Tragic
6.2%
Dutch West Indians
0.0
/100
|
#275
Tragic
6.2%
Immigrants | Ghana
0.0
/100
|
#276
Tragic
6.2%
Mexican American Indians
0.0
/100
|
#277
Tragic
6.2%
Immigrants | Barbados
0.0
/100
|
#278
Tragic
6.2%
Immigrants | Portugal
0.0
/100
|
#279
Tragic
6.3%

Demographics Similar to Immigrants from Norway by Unemployment Among Women with Children Under 18 years

In terms of unemployment among women with children under 18 years, the demographic groups most similar to Immigrants from Norway are Venezuelan (5.3%, a difference of 0.020%), Immigrants from Venezuela (5.3%, a difference of 0.080%), Chilean (5.3%, a difference of 0.12%), Immigrants from England (5.3%, a difference of 0.13%), and Immigrants from Egypt (5.3%, a difference of 0.21%).
DemographicsRating | RankUnemployment Among Women with Children Under 18 years
Ethiopians
80.7
/100
|
#133
Excellent
5.3%
Slovaks
80.5
/100
|
#134
Excellent
5.3%
New Zealanders
79.9
/100
|
#135
Good
5.3%
Immigrants | Jordan
79.5
/100
|
#136
Good
5.3%
Jordanians
78.8
/100
|
#137
Good
5.3%
Argentineans
78.8
/100
|
#138
Good
5.3%
Immigrants | Ukraine
78.5
/100
|
#139
Good
5.3%
Immigrants | Norway
76.2
/100
|
#140
Good
5.3%
Venezuelans
76.0
/100
|
#141
Good
5.3%
Immigrants | Venezuela
75.4
/100
|
#142
Good
5.3%
Chileans
75.0
/100
|
#143
Good
5.3%
Immigrants | England
74.9
/100
|
#144
Good
5.3%
Immigrants | Egypt
74.0
/100
|
#145
Good
5.3%
Immigrants | Belarus
73.4
/100
|
#146
Good
5.3%
Bangladeshis
73.2
/100
|
#147
Good
5.3%