Russian vs Immigrants from Afghanistan Unemployment Among Ages 45 to 54 years

COMPARE

Russian
Race
Ancestry
AfghanAfricanAlaska NativeAlaskan AthabascanAlbanianAleutAlsatianAmericanApacheArabArapahoArgentineanArmenianAssyrian/Chaldean/SyriacAustralianAustrianBahamianBangladeshiBarbadianBasqueBelgianBelizeanBermudanBhutaneseBlackfeetBolivianBrazilianBritishBritish West IndianBulgarianBurmeseCajunCambodianCanadianCape VerdeanCarpatho RusynCelticCentral AmericanCentral American IndianCherokeeCheyenneChickasawChileanChineseChippewaChoctawColombianColvilleComancheCosta RicanCreeCreekCroatianCrowCubanCypriotCzechCzechoslovakianDanishDelawareDominicanDutchDutch West IndianEastern EuropeanEcuadorianEgyptianEnglishEstonianEthiopianEuropeanFijianFilipinoFinnishFrenchFrench American IndianFrench CanadianGermanGerman RussianGhanaianGreekGuamanian/ChamorroGuatemalanGuyaneseHaitianHmongHonduranHopiHoumaHungarianIcelanderIndian (Asian)IndonesianInupiatIranianIraqiIrishIroquoisIsraeliItalianJamaicanJapaneseJordanianKenyanKiowaKoreanLaotianLatvianLebaneseLiberianLithuanianLumbeeLuxembourgerMacedonianMalaysianMalteseMarshalleseMenomineeMexicanMexican American IndianMongolianMoroccanNative HawaiianNavajoNepaleseNew ZealanderNicaraguanNigerianNorthern EuropeanNorwegianOkinawanOsageOttawaPaiutePakistaniPalestinianPanamanianParaguayanPennsylvania GermanPeruvianPimaPolishPortuguesePotawatomiPuebloPuerto RicanPuget Sound SalishRomanianRussianSalvadoranSamoanScandinavianScotch-IrishScottishSeminoleSenegaleseSerbianShoshoneSierra LeoneanSiouxSlavicSlovakSloveneSomaliSouth AfricanSouth AmericanSouth American IndianSoviet UnionSpaniardSpanishSpanish AmericanSpanish American IndianSri LankanSubsaharan AfricanSudaneseSwedishSwissSyrianTaiwaneseThaiTlingit-HaidaTohono O'OdhamTonganTrinidadian and TobagonianTsimshianTurkishU.S. Virgin IslanderUgandanUkrainianUruguayanUteVenezuelanVietnameseWelshWest IndianYakamaYaquiYugoslavianYumanYup'ikZimbabwean
Immigration
NonimmigrantsImmigrantsAfricaAlbaniaArgentinaArmeniaAsiaAustraliaAustriaBahamasBangladeshBarbadosBelarusBelgiumBelizeBoliviaBosnia and HerzegovinaBrazilBulgariaBurma/MyanmarCabo VerdeCambodiaCameroonCanadaCaribbeanCentral AmericaChileChinaColombiaCongoCosta RicaCroatiaCubaCzechoslovakiaDenmarkDominicaDominican RepublicEastern AfricaEastern AsiaEastern EuropeEcuadorEgyptEl SalvadorEnglandEritreaEthiopiaEuropeFijiFranceGermanyGhanaGreeceGrenadaGuatemalaGuyanaHaitiHondurasHong KongHungaryIndiaIndonesiaIranIraqIrelandIsraelItalyJamaicaJapanJordanKazakhstanKenyaKoreaKuwaitLaosLatin AmericaLatviaLebanonLiberiaLithuaniaMalaysiaMexicoMicronesiaMiddle AfricaMoldovaMoroccoNepalNetherlandsNicaraguaNigeriaNorth AmericaNorth MacedoniaNorthern AfricaNorthern EuropeNorwayOceaniaPakistanPanamaPeruPhilippinesPolandPortugalRomaniaRussiaSaudi ArabiaScotlandSenegalSerbiaSierra LeoneSingaporeSomaliaSouth AfricaSouth AmericaSouth Central AsiaSouth Eastern AsiaSouthern EuropeSpainSri LankaSt. Vincent and the GrenadinesSudanSwedenSwitzerlandSyriaTaiwanThailandTrinidad and TobagoTurkeyUgandaUkraineUruguayUzbekistanVenezuelaVietnamWest IndiesWestern AfricaWestern AsiaWestern EuropeYemenZaireZimbabweAzores
Immigrants from Afghanistan
Race
Ancestry
AfghanAfricanAlaska NativeAlaskan AthabascanAlbanianAleutAlsatianAmericanApacheArabArapahoArgentineanArmenianAssyrian/Chaldean/SyriacAustralianAustrianBahamianBangladeshiBarbadianBasqueBelgianBelizeanBermudanBhutaneseBlackfeetBolivianBrazilianBritishBritish West IndianBulgarianBurmeseCajunCambodianCanadianCape VerdeanCarpatho RusynCelticCentral AmericanCentral American IndianCherokeeCheyenneChickasawChileanChineseChippewaChoctawColombianColvilleComancheCosta RicanCreeCreekCroatianCrowCubanCypriotCzechCzechoslovakianDanishDelawareDominicanDutchDutch West IndianEastern EuropeanEcuadorianEgyptianEnglishEstonianEthiopianEuropeanFijianFilipinoFinnishFrenchFrench American IndianFrench CanadianGermanGerman RussianGhanaianGreekGuamanian/ChamorroGuatemalanGuyaneseHaitianHmongHonduranHopiHoumaHungarianIcelanderIndian (Asian)IndonesianInupiatIranianIraqiIrishIroquoisIsraeliItalianJamaicanJapaneseJordanianKenyanKiowaKoreanLaotianLatvianLebaneseLiberianLithuanianLumbeeLuxembourgerMacedonianMalaysianMalteseMarshalleseMenomineeMexicanMexican American IndianMongolianMoroccanNative HawaiianNavajoNepaleseNew ZealanderNicaraguanNigerianNorthern EuropeanNorwegianOkinawanOsageOttawaPaiutePakistaniPalestinianPanamanianParaguayanPennsylvania GermanPeruvianPimaPolishPortuguesePotawatomiPuebloPuerto RicanPuget Sound SalishRomanianSalvadoranSamoanScandinavianScotch-IrishScottishSeminoleSenegaleseSerbianShoshoneSierra LeoneanSiouxSlavicSlovakSloveneSomaliSouth AfricanSouth AmericanSouth American IndianSoviet UnionSpaniardSpanishSpanish AmericanSpanish American IndianSri LankanSubsaharan AfricanSudaneseSwedishSwissSyrianTaiwaneseThaiTlingit-HaidaTohono O'OdhamTonganTrinidadian and TobagonianTsimshianTurkishU.S. Virgin IslanderUgandanUkrainianUruguayanUteVenezuelanVietnameseWelshWest IndianYakamaYaquiYugoslavianYumanYup'ikZimbabwean
Immigration
NonimmigrantsImmigrantsAfghanistanAfricaAlbaniaArgentinaArmeniaAsiaAustraliaAustriaBahamasBangladeshBarbadosBelarusBelgiumBelizeBoliviaBosnia and HerzegovinaBrazilBulgariaBurma/MyanmarCabo VerdeCambodiaCameroonCanadaCaribbeanCentral AmericaChileChinaColombiaCongoCosta RicaCroatiaCubaCzechoslovakiaDenmarkDominicaDominican RepublicEastern AfricaEastern AsiaEastern EuropeEcuadorEgyptEl SalvadorEnglandEritreaEthiopiaEuropeFijiFranceGermanyGhanaGreeceGrenadaGuatemalaGuyanaHaitiHondurasHong KongHungaryIndiaIndonesiaIranIraqIrelandIsraelItalyJamaicaJapanJordanKazakhstanKenyaKoreaKuwaitLaosLatin AmericaLatviaLebanonLiberiaLithuaniaMalaysiaMexicoMicronesiaMiddle AfricaMoldovaMoroccoNepalNetherlandsNicaraguaNigeriaNorth AmericaNorth MacedoniaNorthern AfricaNorthern EuropeNorwayOceaniaPakistanPanamaPeruPhilippinesPolandPortugalRomaniaRussiaSaudi ArabiaScotlandSenegalSerbiaSierra LeoneSingaporeSomaliaSouth AfricaSouth AmericaSouth Central AsiaSouth Eastern AsiaSouthern EuropeSpainSri LankaSt. Vincent and the GrenadinesSudanSwedenSwitzerlandSyriaTaiwanThailandTrinidad and TobagoTurkeyUgandaUkraineUruguayUzbekistanVenezuelaVietnamWest IndiesWestern AfricaWestern AsiaWestern EuropeYemenZaireZimbabweAzores
Unemployment Among Ages 45 to 54 years
Income
Poverty
Unemployment
Labor Participation
Family Structure
Vehicle Availability
Education Level
Disability

Unemployment Among Ages 45 to 54 years Comparison

Russians

Immigrants from Afghanistan

Exceptional
Good
4.4%
UNEMPLOYMENT AMONG AGES 45 TO 54 YEARS
92.1/ 100
METRIC RATING
108th/ 347
METRIC RANK
4.4%
UNEMPLOYMENT AMONG AGES 45 TO 54 YEARS
79.6/ 100
METRIC RATING
141st/ 347
METRIC RANK

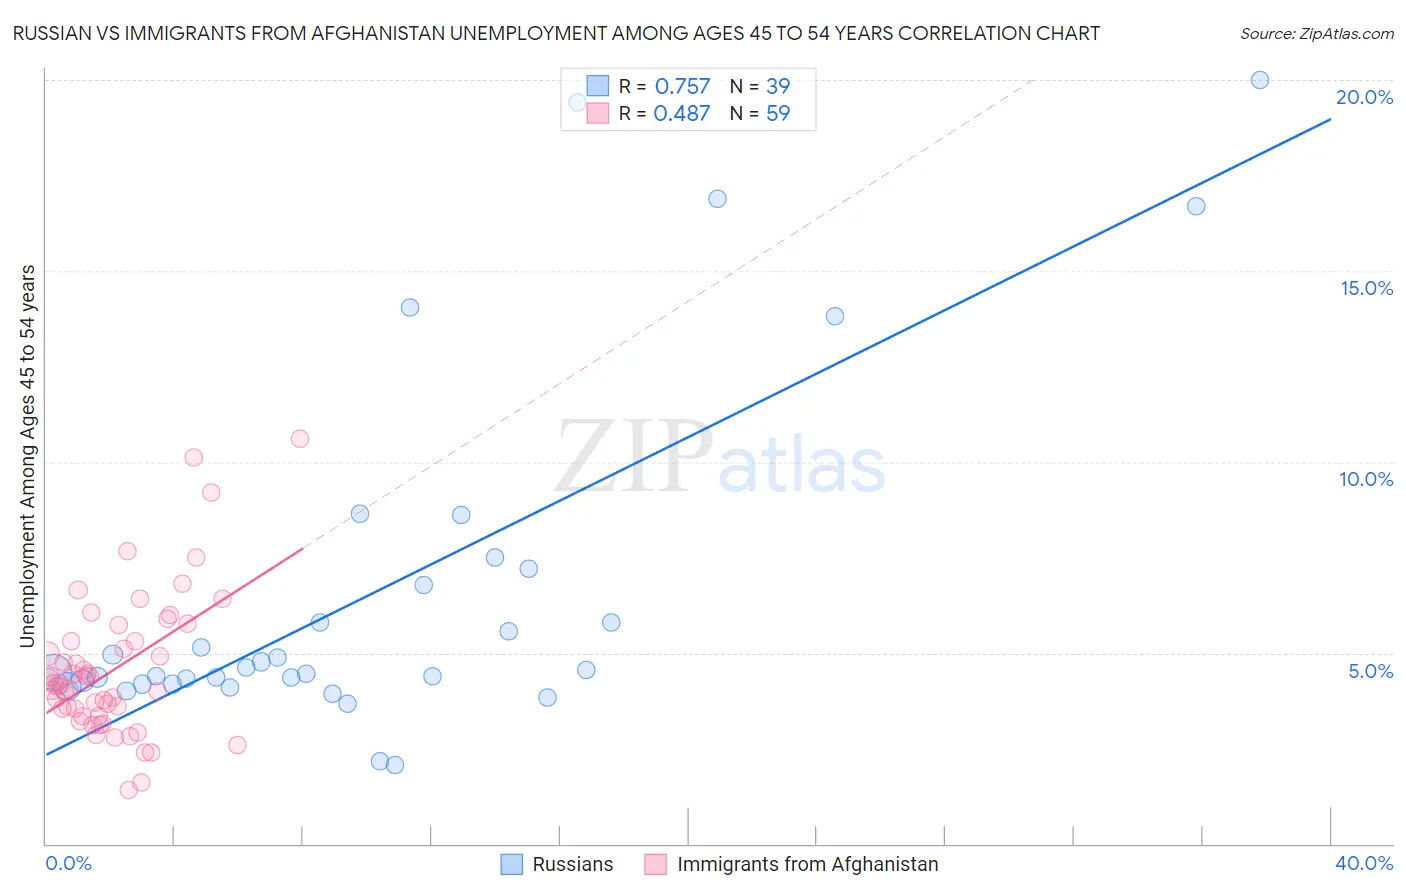
Russian vs Immigrants from Afghanistan Unemployment Among Ages 45 to 54 years Correlation Chart

The statistical analysis conducted on geographies consisting of 486,020,320 people shows a strong positive correlation between the proportion of Russians and unemployment rate among population between the ages 45 and 54 in the United States with a correlation coefficient (R) of 0.757 and weighted average of 4.4%. Similarly, the statistical analysis conducted on geographies consisting of 146,637,469 people shows a moderate positive correlation between the proportion of Immigrants from Afghanistan and unemployment rate among population between the ages 45 and 54 in the United States with a correlation coefficient (R) of 0.487 and weighted average of 4.4%, a difference of 1.3%.
Russian vs Immigrants from Afghanistan Unemployment Among Ages 45 to 54 years

Unemployment Among Ages 45 to 54 years Correlation Summary

MeasurementRussianImmigrants from Afghanistan
Minimum2.1%1.4%
Maximum20.0%10.6%
Range17.9%9.2%
Mean6.7%4.6%
Median4.6%4.2%
Interquartile 25% (IQ1)4.2%3.3%
Interquartile 75% (IQ3)7.2%5.3%
Interquartile Range (IQR)3.0%2.0%
Standard Deviation (Sample)4.7%1.8%
Standard Deviation (Population)4.6%1.8%

Similar Demographics by Unemployment Among Ages 45 to 54 years

Demographics Similar to Russians by Unemployment Among Ages 45 to 54 years

In terms of unemployment among ages 45 to 54 years, the demographic groups most similar to Russians are New Zealander (4.4%, a difference of 0.030%), Iranian (4.4%, a difference of 0.060%), Immigrants from South Africa (4.4%, a difference of 0.060%), Immigrants from Kenya (4.4%, a difference of 0.12%), and Immigrants from England (4.4%, a difference of 0.12%).
DemographicsRating | RankUnemployment Among Ages 45 to 54 years
Immigrants | North America
93.9
/100
|
#101
Exceptional
4.4%
Sri Lankans
93.7
/100
|
#102
Exceptional
4.4%
Icelanders
93.5
/100
|
#103
Exceptional
4.4%
Immigrants | Sweden
93.0
/100
|
#104
Exceptional
4.4%
Immigrants | Kenya
92.8
/100
|
#105
Exceptional
4.4%
Iranians
92.5
/100
|
#106
Exceptional
4.4%
Immigrants | South Africa
92.5
/100
|
#107
Exceptional
4.4%
Russians
92.1
/100
|
#108
Exceptional
4.4%
New Zealanders
91.9
/100
|
#109
Exceptional
4.4%
Immigrants | England
91.3
/100
|
#110
Exceptional
4.4%
Immigrants | Nicaragua
91.3
/100
|
#111
Exceptional
4.4%
Immigrants | Saudi Arabia
91.1
/100
|
#112
Exceptional
4.4%
French Canadians
91.0
/100
|
#113
Exceptional
4.4%
Immigrants | Chile
90.9
/100
|
#114
Exceptional
4.4%
Pakistanis
90.7
/100
|
#115
Exceptional
4.4%

Demographics Similar to Immigrants from Afghanistan by Unemployment Among Ages 45 to 54 years

In terms of unemployment among ages 45 to 54 years, the demographic groups most similar to Immigrants from Afghanistan are Immigrants from Netherlands (4.4%, a difference of 0.020%), Macedonian (4.5%, a difference of 0.040%), Immigrants from Zaire (4.4%, a difference of 0.080%), Taiwanese (4.5%, a difference of 0.12%), and Immigrants from Latvia (4.5%, a difference of 0.15%).
DemographicsRating | RankUnemployment Among Ages 45 to 54 years
Afghans
84.6
/100
|
#134
Excellent
4.4%
Immigrants | Eastern Asia
84.0
/100
|
#135
Excellent
4.4%
Immigrants | Middle Africa
83.3
/100
|
#136
Excellent
4.4%
Lebanese
81.9
/100
|
#137
Excellent
4.4%
Immigrants | Congo
81.8
/100
|
#138
Excellent
4.4%
Immigrants | Kuwait
81.7
/100
|
#139
Excellent
4.4%
Immigrants | Zaire
80.7
/100
|
#140
Excellent
4.4%
Immigrants | Afghanistan
79.6
/100
|
#141
Good
4.4%
Immigrants | Netherlands
79.4
/100
|
#142
Good
4.4%
Macedonians
79.0
/100
|
#143
Good
4.5%
Taiwanese
77.9
/100
|
#144
Good
4.5%
Immigrants | Latvia
77.5
/100
|
#145
Good
4.5%
Syrians
77.3
/100
|
#146
Good
4.5%
Uruguayans
76.9
/100
|
#147
Good
4.5%
Immigrants | Austria
75.3
/100
|
#148
Good
4.5%