Portuguese vs Tlingit-Haida Unemployment

COMPARE

Portuguese
Race
Ancestry
AfghanAfricanAlaska NativeAlaskan AthabascanAlbanianAleutAlsatianAmericanApacheArabArapahoArgentineanArmenianAssyrian/Chaldean/SyriacAustralianAustrianBahamianBangladeshiBarbadianBasqueBelgianBelizeanBermudanBhutaneseBlackfeetBolivianBrazilianBritishBritish West IndianBulgarianBurmeseCajunCambodianCanadianCape VerdeanCarpatho RusynCelticCentral AmericanCentral American IndianCherokeeCheyenneChickasawChileanChineseChippewaChoctawColombianColvilleComancheCosta RicanCreeCreekCroatianCrowCubanCypriotCzechCzechoslovakianDanishDelawareDominicanDutchDutch West IndianEastern EuropeanEcuadorianEgyptianEnglishEstonianEthiopianEuropeanFijianFilipinoFinnishFrenchFrench American IndianFrench CanadianGermanGerman RussianGhanaianGreekGuamanian/ChamorroGuatemalanGuyaneseHaitianHmongHonduranHopiHoumaHungarianIcelanderIndian (Asian)IndonesianInupiatIranianIraqiIrishIroquoisIsraeliItalianJamaicanJapaneseJordanianKenyanKiowaKoreanLaotianLatvianLebaneseLiberianLithuanianLumbeeLuxembourgerMacedonianMalaysianMalteseMarshalleseMenomineeMexicanMexican American IndianMongolianMoroccanNative HawaiianNavajoNepaleseNew ZealanderNicaraguanNigerianNorthern EuropeanNorwegianOkinawanOsageOttawaPaiutePakistaniPalestinianPanamanianParaguayanPennsylvania GermanPeruvianPimaPolishPortuguesePotawatomiPuebloPuerto RicanPuget Sound SalishRomanianRussianSalvadoranSamoanScandinavianScotch-IrishScottishSeminoleSenegaleseSerbianShoshoneSierra LeoneanSiouxSlavicSlovakSloveneSomaliSouth AfricanSouth AmericanSouth American IndianSoviet UnionSpaniardSpanishSpanish AmericanSpanish American IndianSri LankanSubsaharan AfricanSudaneseSwedishSwissSyrianTaiwaneseThaiTohono O'OdhamTonganTrinidadian and TobagonianTsimshianTurkishU.S. Virgin IslanderUgandanUkrainianUruguayanUteVenezuelanVietnameseWelshWest IndianYakamaYaquiYugoslavianYumanYup'ikZimbabwean
Immigration
NonimmigrantsImmigrantsAfghanistanAfricaAlbaniaArgentinaArmeniaAsiaAustraliaAustriaBahamasBangladeshBarbadosBelarusBelgiumBelizeBoliviaBosnia and HerzegovinaBrazilBulgariaBurma/MyanmarCabo VerdeCambodiaCameroonCanadaCaribbeanCentral AmericaChileChinaColombiaCongoCosta RicaCroatiaCubaCzechoslovakiaDenmarkDominicaDominican RepublicEastern AfricaEastern AsiaEastern EuropeEcuadorEgyptEl SalvadorEnglandEritreaEthiopiaEuropeFijiFranceGermanyGhanaGreeceGrenadaGuatemalaGuyanaHaitiHondurasHong KongHungaryIndiaIndonesiaIranIraqIrelandIsraelItalyJamaicaJapanJordanKazakhstanKenyaKoreaKuwaitLaosLatin AmericaLatviaLebanonLiberiaLithuaniaMalaysiaMexicoMicronesiaMiddle AfricaMoldovaMoroccoNepalNetherlandsNicaraguaNigeriaNorth AmericaNorth MacedoniaNorthern AfricaNorthern EuropeNorwayOceaniaPakistanPanamaPeruPhilippinesPolandPortugalRomaniaRussiaSaudi ArabiaScotlandSenegalSerbiaSierra LeoneSingaporeSomaliaSouth AfricaSouth AmericaSouth Central AsiaSouth Eastern AsiaSouthern EuropeSpainSri LankaSt. Vincent and the GrenadinesSudanSwedenSwitzerlandSyriaTaiwanThailandTrinidad and TobagoTurkeyUgandaUkraineUruguayUzbekistanVenezuelaVietnamWest IndiesWestern AfricaWestern AsiaWestern EuropeYemenZaireZimbabweAzores
Tlingit-Haida
Race
Ancestry
AfghanAfricanAlaska NativeAlaskan AthabascanAlbanianAleutAlsatianAmericanApacheArabArapahoArgentineanArmenianAssyrian/Chaldean/SyriacAustralianAustrianBahamianBangladeshiBarbadianBasqueBelgianBelizeanBermudanBhutaneseBlackfeetBolivianBrazilianBritishBritish West IndianBulgarianBurmeseCajunCambodianCanadianCape VerdeanCarpatho RusynCelticCentral AmericanCentral American IndianCherokeeCheyenneChickasawChileanChineseChippewaChoctawColombianColvilleComancheCosta RicanCreeCreekCroatianCrowCubanCypriotCzechCzechoslovakianDanishDelawareDominicanDutchDutch West IndianEastern EuropeanEcuadorianEgyptianEnglishEstonianEthiopianEuropeanFijianFilipinoFinnishFrenchFrench American IndianFrench CanadianGermanGerman RussianGhanaianGreekGuamanian/ChamorroGuatemalanGuyaneseHaitianHmongHonduranHopiHoumaHungarianIcelanderIndian (Asian)IndonesianInupiatIranianIraqiIrishIroquoisIsraeliItalianJamaicanJapaneseJordanianKenyanKiowaKoreanLaotianLatvianLebaneseLiberianLithuanianLumbeeLuxembourgerMacedonianMalaysianMalteseMarshalleseMenomineeMexicanMexican American IndianMongolianMoroccanNative HawaiianNavajoNepaleseNew ZealanderNicaraguanNigerianNorthern EuropeanNorwegianOkinawanOsageOttawaPaiutePakistaniPalestinianPanamanianParaguayanPennsylvania GermanPeruvianPimaPolishPotawatomiPuebloPuerto RicanPuget Sound SalishRomanianRussianSalvadoranSamoanScandinavianScotch-IrishScottishSeminoleSenegaleseSerbianShoshoneSierra LeoneanSiouxSlavicSlovakSloveneSomaliSouth AfricanSouth AmericanSouth American IndianSoviet UnionSpaniardSpanishSpanish AmericanSpanish American IndianSri LankanSubsaharan AfricanSudaneseSwedishSwissSyrianTaiwaneseThaiTlingit-HaidaTohono O'OdhamTonganTrinidadian and TobagonianTsimshianTurkishU.S. Virgin IslanderUgandanUkrainianUruguayanUteVenezuelanVietnameseWelshWest IndianYakamaYaquiYugoslavianYumanYup'ikZimbabwean
Immigration
NonimmigrantsImmigrantsAfghanistanAfricaAlbaniaArgentinaArmeniaAsiaAustraliaAustriaBahamasBangladeshBarbadosBelarusBelgiumBelizeBoliviaBosnia and HerzegovinaBrazilBulgariaBurma/MyanmarCabo VerdeCambodiaCameroonCanadaCaribbeanCentral AmericaChileChinaColombiaCongoCosta RicaCroatiaCubaCzechoslovakiaDenmarkDominicaDominican RepublicEastern AfricaEastern AsiaEastern EuropeEcuadorEgyptEl SalvadorEnglandEritreaEthiopiaEuropeFijiFranceGermanyGhanaGreeceGrenadaGuatemalaGuyanaHaitiHondurasHong KongHungaryIndiaIndonesiaIranIraqIrelandIsraelItalyJamaicaJapanJordanKazakhstanKenyaKoreaKuwaitLaosLatin AmericaLatviaLebanonLiberiaLithuaniaMalaysiaMexicoMicronesiaMiddle AfricaMoldovaMoroccoNepalNetherlandsNicaraguaNigeriaNorth AmericaNorth MacedoniaNorthern AfricaNorthern EuropeNorwayOceaniaPakistanPanamaPeruPhilippinesPolandPortugalRomaniaRussiaSaudi ArabiaScotlandSenegalSerbiaSierra LeoneSingaporeSomaliaSouth AfricaSouth AmericaSouth Central AsiaSouth Eastern AsiaSouthern EuropeSpainSri LankaSt. Vincent and the GrenadinesSudanSwedenSwitzerlandSyriaTaiwanThailandTrinidad and TobagoTurkeyUgandaUkraineUruguayUzbekistanVenezuelaVietnamWest IndiesWestern AfricaWestern AsiaWestern EuropeYemenZaireZimbabweAzores
Unemployment
Income
Poverty
Unemployment
Labor Participation
Family Structure
Vehicle Availability
Education Level
Disability

Unemployment Comparison

Portuguese

Tlingit-Haida

Poor
Tragic
5.4%
UNEMPLOYMENT
19.0/ 100
METRIC RATING
208th/ 347
METRIC RANK
5.6%
UNEMPLOYMENT
2.0/ 100
METRIC RATING
241st/ 347
METRIC RANK

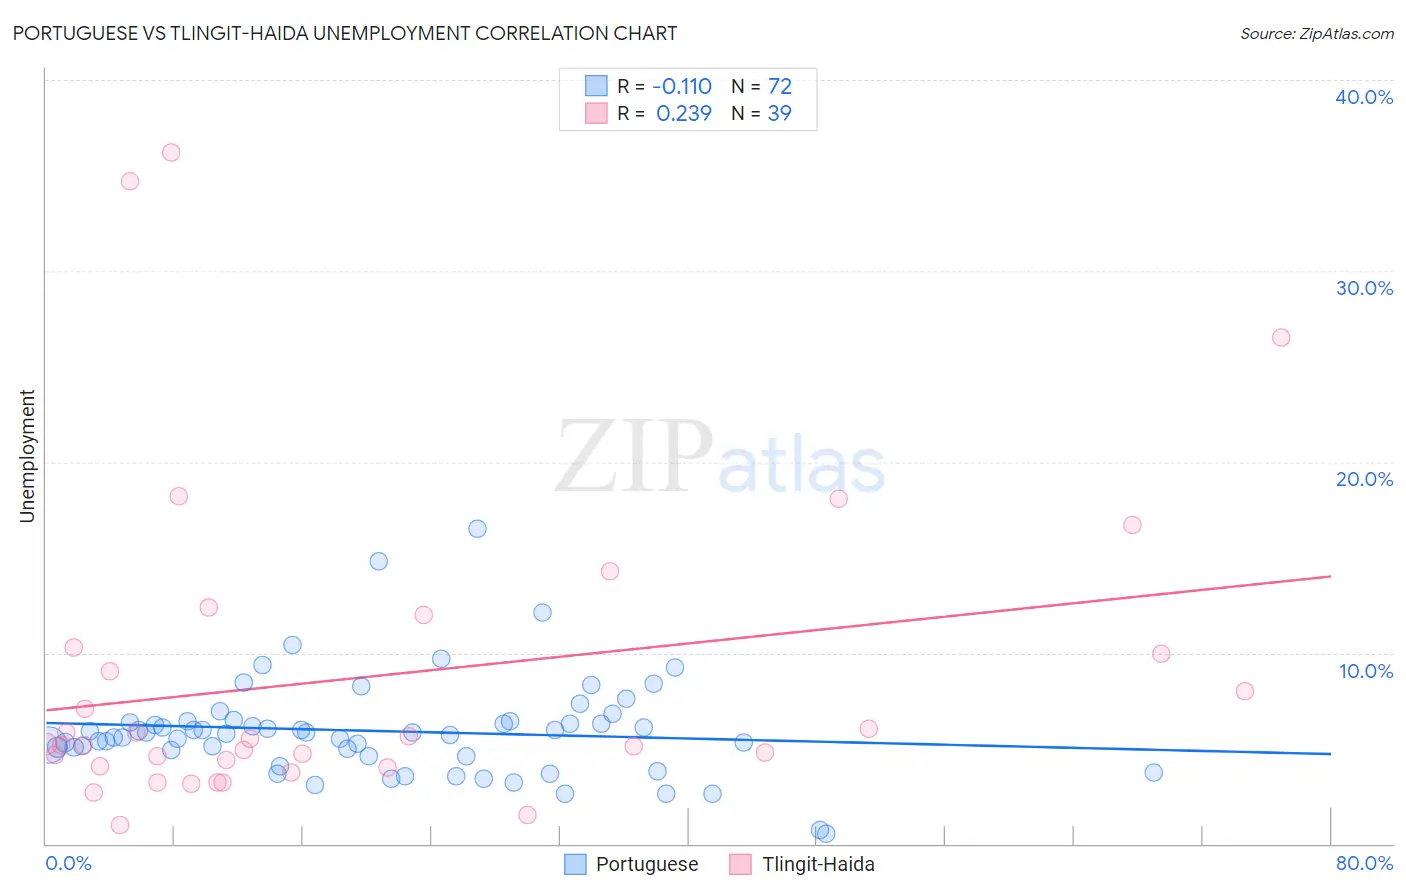
Portuguese vs Tlingit-Haida Unemployment Correlation Chart

The statistical analysis conducted on geographies consisting of 449,464,903 people shows a poor negative correlation between the proportion of Portuguese and unemployment in the United States with a correlation coefficient (R) of -0.110 and weighted average of 5.4%. Similarly, the statistical analysis conducted on geographies consisting of 60,829,172 people shows a weak positive correlation between the proportion of Tlingit-Haida and unemployment in the United States with a correlation coefficient (R) of 0.239 and weighted average of 5.6%, a difference of 3.6%.
Portuguese vs Tlingit-Haida Unemployment

Unemployment Correlation Summary

MeasurementPortugueseTlingit-Haida
Minimum0.50%1.0%
Maximum16.5%36.2%
Range16.0%35.2%
Mean5.9%8.7%
Median5.8%5.2%
Interquartile 25% (IQ1)4.8%4.0%
Interquartile 75% (IQ3)6.4%10.3%
Interquartile Range (IQR)1.6%6.3%
Standard Deviation (Sample)2.6%8.2%
Standard Deviation (Population)2.6%8.1%

Similar Demographics by Unemployment

Demographics Similar to Portuguese by Unemployment

In terms of unemployment, the demographic groups most similar to Portuguese are Creek (5.4%, a difference of 0.030%), Immigrants from Iran (5.4%, a difference of 0.030%), Immigrants from Iraq (5.4%, a difference of 0.050%), Iraqi (5.4%, a difference of 0.10%), and Ugandan (5.4%, a difference of 0.11%).
DemographicsRating | RankUnemployment
Immigrants | South Eastern Asia
27.0
/100
|
#201
Fair
5.3%
Cherokee
25.5
/100
|
#202
Fair
5.3%
Immigrants | Micronesia
25.2
/100
|
#203
Fair
5.3%
Immigrants | Ukraine
24.9
/100
|
#204
Fair
5.3%
Native Hawaiians
24.1
/100
|
#205
Fair
5.3%
Immigrants | Peru
22.7
/100
|
#206
Fair
5.4%
Creek
19.4
/100
|
#207
Poor
5.4%
Portuguese
19.0
/100
|
#208
Poor
5.4%
Immigrants | Iran
18.8
/100
|
#209
Poor
5.4%
Immigrants | Iraq
18.6
/100
|
#210
Poor
5.4%
Iraqis
18.1
/100
|
#211
Poor
5.4%
Ugandans
18.0
/100
|
#212
Poor
5.4%
Immigrants | Middle Africa
15.3
/100
|
#213
Poor
5.4%
Immigrants | Costa Rica
15.2
/100
|
#214
Poor
5.4%
Delaware
14.7
/100
|
#215
Poor
5.4%

Demographics Similar to Tlingit-Haida by Unemployment

In terms of unemployment, the demographic groups most similar to Tlingit-Haida are Spanish American (5.6%, a difference of 0.0%), Cree (5.6%, a difference of 0.34%), Immigrants (5.5%, a difference of 0.35%), Immigrants from Western Asia (5.5%, a difference of 0.44%), and Marshallese (5.6%, a difference of 0.64%).
DemographicsRating | RankUnemployment
Panamanians
4.7
/100
|
#234
Tragic
5.5%
Immigrants | Panama
3.4
/100
|
#235
Tragic
5.5%
Immigrants | Cambodia
3.3
/100
|
#236
Tragic
5.5%
Moroccans
3.2
/100
|
#237
Tragic
5.5%
Immigrants | Western Asia
2.8
/100
|
#238
Tragic
5.5%
Immigrants | Immigrants
2.6
/100
|
#239
Tragic
5.5%
Cree
2.6
/100
|
#240
Tragic
5.6%
Tlingit-Haida
2.0
/100
|
#241
Tragic
5.6%
Spanish Americans
2.0
/100
|
#242
Tragic
5.6%
Marshallese
1.3
/100
|
#243
Tragic
5.6%
Dutch West Indians
1.2
/100
|
#244
Tragic
5.6%
French American Indians
1.2
/100
|
#245
Tragic
5.6%
Bermudans
1.1
/100
|
#246
Tragic
5.6%
Immigrants | Cameroon
1.0
/100
|
#247
Tragic
5.6%
Liberians
0.9
/100
|
#248
Tragic
5.6%