Portuguese vs Macedonian Unemployment Among Ages 16 to 19 years

COMPARE

Portuguese
Race
Ancestry
AfghanAfricanAlaska NativeAlaskan AthabascanAlbanianAleutAlsatianAmericanApacheArabArapahoArgentineanArmenianAssyrian/Chaldean/SyriacAustralianAustrianBahamianBangladeshiBarbadianBasqueBelgianBelizeanBermudanBhutaneseBlackfeetBolivianBrazilianBritishBritish West IndianBulgarianBurmeseCajunCambodianCanadianCape VerdeanCarpatho RusynCelticCentral AmericanCentral American IndianCherokeeCheyenneChickasawChileanChineseChippewaChoctawColombianColvilleComancheCosta RicanCreeCreekCroatianCrowCubanCypriotCzechCzechoslovakianDanishDelawareDominicanDutchDutch West IndianEastern EuropeanEcuadorianEgyptianEnglishEstonianEthiopianEuropeanFijianFilipinoFinnishFrenchFrench American IndianFrench CanadianGermanGerman RussianGhanaianGreekGuamanian/ChamorroGuatemalanGuyaneseHaitianHmongHonduranHopiHoumaHungarianIcelanderIndian (Asian)IndonesianInupiatIranianIraqiIrishIroquoisIsraeliItalianJamaicanJapaneseJordanianKenyanKiowaKoreanLaotianLatvianLebaneseLiberianLithuanianLumbeeLuxembourgerMalaysianMalteseMarshalleseMenomineeMexicanMexican American IndianMongolianMoroccanNative HawaiianNavajoNepaleseNew ZealanderNicaraguanNigerianNorthern EuropeanNorwegianOkinawanOsageOttawaPaiutePakistaniPalestinianPanamanianParaguayanPennsylvania GermanPeruvianPimaPolishPortuguesePotawatomiPuebloPuerto RicanPuget Sound SalishRomanianRussianSalvadoranSamoanScandinavianScotch-IrishScottishSeminoleSenegaleseSerbianShoshoneSierra LeoneanSiouxSlavicSlovakSloveneSomaliSouth AfricanSouth AmericanSouth American IndianSoviet UnionSpaniardSpanishSpanish AmericanSpanish American IndianSri LankanSubsaharan AfricanSudaneseSwedishSwissSyrianTaiwaneseThaiTlingit-HaidaTohono O'OdhamTonganTrinidadian and TobagonianTsimshianTurkishU.S. Virgin IslanderUgandanUkrainianUruguayanUteVenezuelanVietnameseWelshWest IndianYakamaYaquiYugoslavianYumanYup'ikZimbabwean
Immigration
NonimmigrantsImmigrantsAfghanistanAfricaAlbaniaArgentinaArmeniaAsiaAustraliaAustriaBahamasBangladeshBarbadosBelarusBelgiumBelizeBoliviaBosnia and HerzegovinaBrazilBulgariaBurma/MyanmarCabo VerdeCambodiaCameroonCanadaCaribbeanCentral AmericaChileChinaColombiaCongoCosta RicaCroatiaCubaCzechoslovakiaDenmarkDominicaDominican RepublicEastern AfricaEastern AsiaEastern EuropeEcuadorEgyptEl SalvadorEnglandEritreaEthiopiaEuropeFijiFranceGermanyGhanaGreeceGrenadaGuatemalaGuyanaHaitiHondurasHong KongHungaryIndiaIndonesiaIranIraqIrelandIsraelItalyJamaicaJapanJordanKazakhstanKenyaKoreaKuwaitLaosLatin AmericaLatviaLebanonLiberiaLithuaniaMalaysiaMexicoMicronesiaMiddle AfricaMoldovaMoroccoNepalNetherlandsNicaraguaNigeriaNorth AmericaNorth MacedoniaNorthern AfricaNorthern EuropeNorwayOceaniaPakistanPanamaPeruPhilippinesPolandPortugalRomaniaRussiaSaudi ArabiaScotlandSenegalSerbiaSierra LeoneSingaporeSomaliaSouth AfricaSouth AmericaSouth Central AsiaSouth Eastern AsiaSouthern EuropeSpainSri LankaSt. Vincent and the GrenadinesSudanSwedenSwitzerlandSyriaTaiwanThailandTrinidad and TobagoTurkeyUgandaUkraineUruguayUzbekistanVenezuelaVietnamWest IndiesWestern AfricaWestern AsiaWestern EuropeYemenZaireZimbabweAzores
Macedonian
Race
Ancestry
AfghanAfricanAlaska NativeAlaskan AthabascanAlbanianAleutAlsatianAmericanApacheArabArapahoArgentineanArmenianAssyrian/Chaldean/SyriacAustralianAustrianBahamianBangladeshiBarbadianBasqueBelgianBelizeanBermudanBhutaneseBlackfeetBolivianBrazilianBritishBritish West IndianBulgarianBurmeseCajunCambodianCanadianCape VerdeanCarpatho RusynCelticCentral AmericanCentral American IndianCherokeeCheyenneChickasawChileanChineseChippewaChoctawColombianColvilleComancheCosta RicanCreeCreekCroatianCrowCubanCypriotCzechCzechoslovakianDanishDelawareDominicanDutchDutch West IndianEastern EuropeanEcuadorianEgyptianEnglishEstonianEthiopianEuropeanFijianFilipinoFinnishFrenchFrench American IndianFrench CanadianGermanGerman RussianGhanaianGreekGuamanian/ChamorroGuatemalanGuyaneseHaitianHmongHonduranHopiHoumaHungarianIcelanderIndian (Asian)IndonesianInupiatIranianIraqiIrishIroquoisIsraeliItalianJamaicanJapaneseJordanianKenyanKiowaKoreanLaotianLatvianLebaneseLiberianLithuanianLumbeeLuxembourgerMacedonianMalaysianMalteseMarshalleseMenomineeMexicanMexican American IndianMongolianMoroccanNative HawaiianNavajoNepaleseNew ZealanderNicaraguanNigerianNorthern EuropeanNorwegianOkinawanOsageOttawaPaiutePakistaniPalestinianPanamanianParaguayanPennsylvania GermanPeruvianPimaPolishPotawatomiPuebloPuerto RicanPuget Sound SalishRomanianRussianSalvadoranSamoanScandinavianScotch-IrishScottishSeminoleSenegaleseSerbianShoshoneSierra LeoneanSiouxSlavicSlovakSloveneSomaliSouth AfricanSouth AmericanSouth American IndianSoviet UnionSpaniardSpanishSpanish AmericanSpanish American IndianSri LankanSubsaharan AfricanSudaneseSwedishSwissSyrianTaiwaneseThaiTlingit-HaidaTohono O'OdhamTonganTrinidadian and TobagonianTsimshianTurkishU.S. Virgin IslanderUgandanUkrainianUruguayanUteVenezuelanVietnameseWelshWest IndianYakamaYaquiYugoslavianYumanYup'ikZimbabwean
Immigration
NonimmigrantsImmigrantsAfghanistanAfricaAlbaniaArgentinaArmeniaAsiaAustraliaAustriaBahamasBangladeshBarbadosBelarusBelgiumBelizeBoliviaBosnia and HerzegovinaBrazilBulgariaBurma/MyanmarCabo VerdeCambodiaCameroonCanadaCaribbeanCentral AmericaChileChinaColombiaCongoCosta RicaCroatiaCubaCzechoslovakiaDenmarkDominicaDominican RepublicEastern AfricaEastern AsiaEastern EuropeEcuadorEgyptEl SalvadorEnglandEritreaEthiopiaEuropeFijiFranceGermanyGhanaGreeceGrenadaGuatemalaGuyanaHaitiHondurasHong KongHungaryIndiaIndonesiaIranIraqIrelandIsraelItalyJamaicaJapanJordanKazakhstanKenyaKoreaKuwaitLaosLatin AmericaLatviaLebanonLiberiaLithuaniaMalaysiaMexicoMicronesiaMiddle AfricaMoldovaMoroccoNepalNetherlandsNicaraguaNigeriaNorth AmericaNorth MacedoniaNorthern AfricaNorthern EuropeNorwayOceaniaPakistanPanamaPeruPhilippinesPolandPortugalRomaniaRussiaSaudi ArabiaScotlandSenegalSerbiaSierra LeoneSingaporeSomaliaSouth AfricaSouth AmericaSouth Central AsiaSouth Eastern AsiaSouthern EuropeSpainSri LankaSt. Vincent and the GrenadinesSudanSwedenSwitzerlandSyriaTaiwanThailandTrinidad and TobagoTurkeyUgandaUkraineUruguayUzbekistanVenezuelaVietnamWest IndiesWestern AfricaWestern AsiaWestern EuropeYemenZaireZimbabweAzores
Unemployment Among Ages 16 to 19 years
Income
Poverty
Unemployment
Labor Participation
Family Structure
Vehicle Availability
Education Level
Disability

Unemployment Among Ages 16 to 19 years Comparison

Portuguese

Macedonians

Good
Exceptional
17.4%
UNEMPLOYMENT AMONG AGES 16 TO 19 YEARS
67.3/ 100
METRIC RATING
155th/ 347
METRIC RANK
16.6%
UNEMPLOYMENT AMONG AGES 16 TO 19 YEARS
99.2/ 100
METRIC RATING
62nd/ 347
METRIC RANK

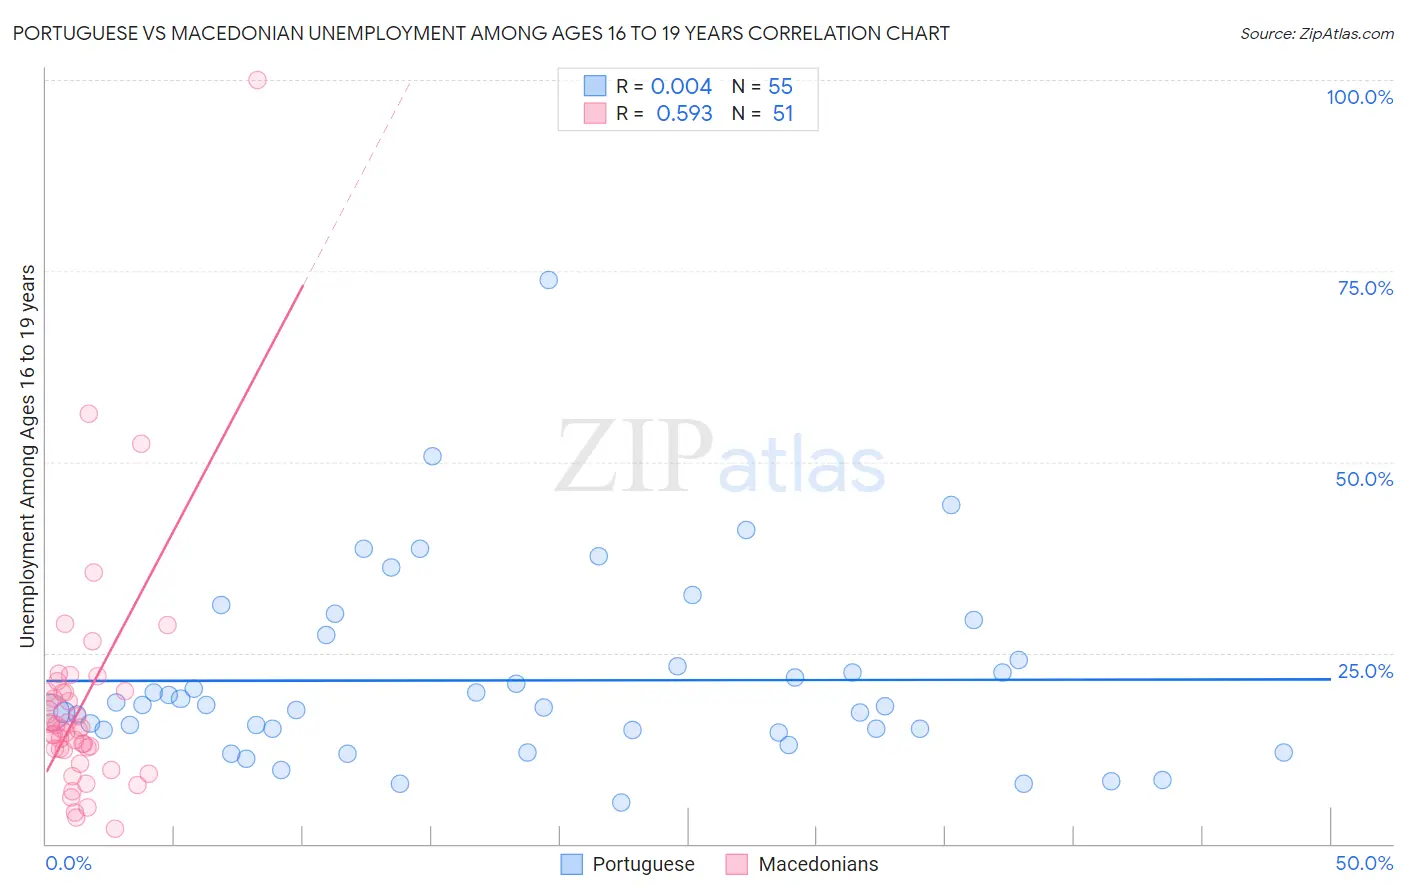
Portuguese vs Macedonian Unemployment Among Ages 16 to 19 years Correlation Chart

The statistical analysis conducted on geographies consisting of 420,400,969 people shows no correlation between the proportion of Portuguese and unemployment rate among population between the ages 16 and 19 in the United States with a correlation coefficient (R) of 0.004 and weighted average of 17.4%. Similarly, the statistical analysis conducted on geographies consisting of 129,038,404 people shows a substantial positive correlation between the proportion of Macedonians and unemployment rate among population between the ages 16 and 19 in the United States with a correlation coefficient (R) of 0.593 and weighted average of 16.6%, a difference of 5.1%.
Portuguese vs Macedonian Unemployment Among Ages 16 to 19 years

Unemployment Among Ages 16 to 19 years Correlation Summary

MeasurementPortugueseMacedonian
Minimum5.4%2.0%
Maximum73.9%100.0%
Range68.5%98.0%
Mean21.4%18.3%
Median18.0%15.0%
Interquartile 25% (IQ1)14.8%12.3%
Interquartile 75% (IQ3)24.0%19.9%
Interquartile Range (IQR)9.2%7.6%
Standard Deviation (Sample)12.3%15.5%
Standard Deviation (Population)12.2%15.3%

Similar Demographics by Unemployment Among Ages 16 to 19 years

Demographics Similar to Portuguese by Unemployment Among Ages 16 to 19 years

In terms of unemployment among ages 16 to 19 years, the demographic groups most similar to Portuguese are Afghan (17.4%, a difference of 0.050%), Immigrants from Afghanistan (17.4%, a difference of 0.070%), Costa Rican (17.4%, a difference of 0.070%), Immigrants from Northern Africa (17.4%, a difference of 0.090%), and Immigrants from Hong Kong (17.4%, a difference of 0.11%).
DemographicsRating | RankUnemployment Among Ages 16 to 19 years
Romanians
74.9
/100
|
#148
Good
17.3%
Immigrants | Eastern Asia
73.8
/100
|
#149
Good
17.4%
Immigrants | Northern Europe
72.5
/100
|
#150
Good
17.4%
Immigrants | Hong Kong
69.3
/100
|
#151
Good
17.4%
Immigrants | Northern Africa
69.0
/100
|
#152
Good
17.4%
Immigrants | Afghanistan
68.6
/100
|
#153
Good
17.4%
Afghans
68.1
/100
|
#154
Good
17.4%
Portuguese
67.3
/100
|
#155
Good
17.4%
Costa Ricans
65.9
/100
|
#156
Good
17.4%
Uruguayans
64.3
/100
|
#157
Good
17.5%
Immigrants | China
64.1
/100
|
#158
Good
17.5%
Koreans
61.0
/100
|
#159
Good
17.5%
Ukrainians
60.5
/100
|
#160
Good
17.5%
Immigrants | Denmark
60.3
/100
|
#161
Good
17.5%
Immigrants | Norway
59.8
/100
|
#162
Average
17.5%

Demographics Similar to Macedonians by Unemployment Among Ages 16 to 19 years

In terms of unemployment among ages 16 to 19 years, the demographic groups most similar to Macedonians are Immigrants from Cuba (16.6%, a difference of 0.10%), Menominee (16.6%, a difference of 0.16%), Scotch-Irish (16.6%, a difference of 0.18%), Northern European (16.6%, a difference of 0.25%), and Irish (16.5%, a difference of 0.33%).
DemographicsRating | RankUnemployment Among Ages 16 to 19 years
Czechoslovakians
99.5
/100
|
#55
Exceptional
16.5%
Sri Lankans
99.5
/100
|
#56
Exceptional
16.5%
Immigrants | Jordan
99.4
/100
|
#57
Exceptional
16.5%
Immigrants | Uganda
99.4
/100
|
#58
Exceptional
16.5%
Irish
99.4
/100
|
#59
Exceptional
16.5%
Menominee
99.3
/100
|
#60
Exceptional
16.6%
Immigrants | Cuba
99.2
/100
|
#61
Exceptional
16.6%
Macedonians
99.2
/100
|
#62
Exceptional
16.6%
Scotch-Irish
99.1
/100
|
#63
Exceptional
16.6%
Northern Europeans
99.0
/100
|
#64
Exceptional
16.6%
Immigrants | Japan
98.9
/100
|
#65
Exceptional
16.6%
Okinawans
98.9
/100
|
#66
Exceptional
16.6%
Slavs
98.7
/100
|
#67
Exceptional
16.7%
Chickasaw
98.7
/100
|
#68
Exceptional
16.7%
Serbians
98.7
/100
|
#69
Exceptional
16.7%