Polish vs German Russian Unemployment Among Ages 60 to 64 years
COMPARE
Polish
German Russian
Unemployment Among Ages 60 to 64 years
Unemployment Among Ages 60 to 64 years Comparison
Poles
German Russians
4.7%
UNEMPLOYMENT AMONG AGES 60 TO 64 YEARS
98.1/ 100
METRIC RATING
96th/ 347
METRIC RANK
4.9%
UNEMPLOYMENT AMONG AGES 60 TO 64 YEARS
16.8/ 100
METRIC RATING
208th/ 347
METRIC RANK
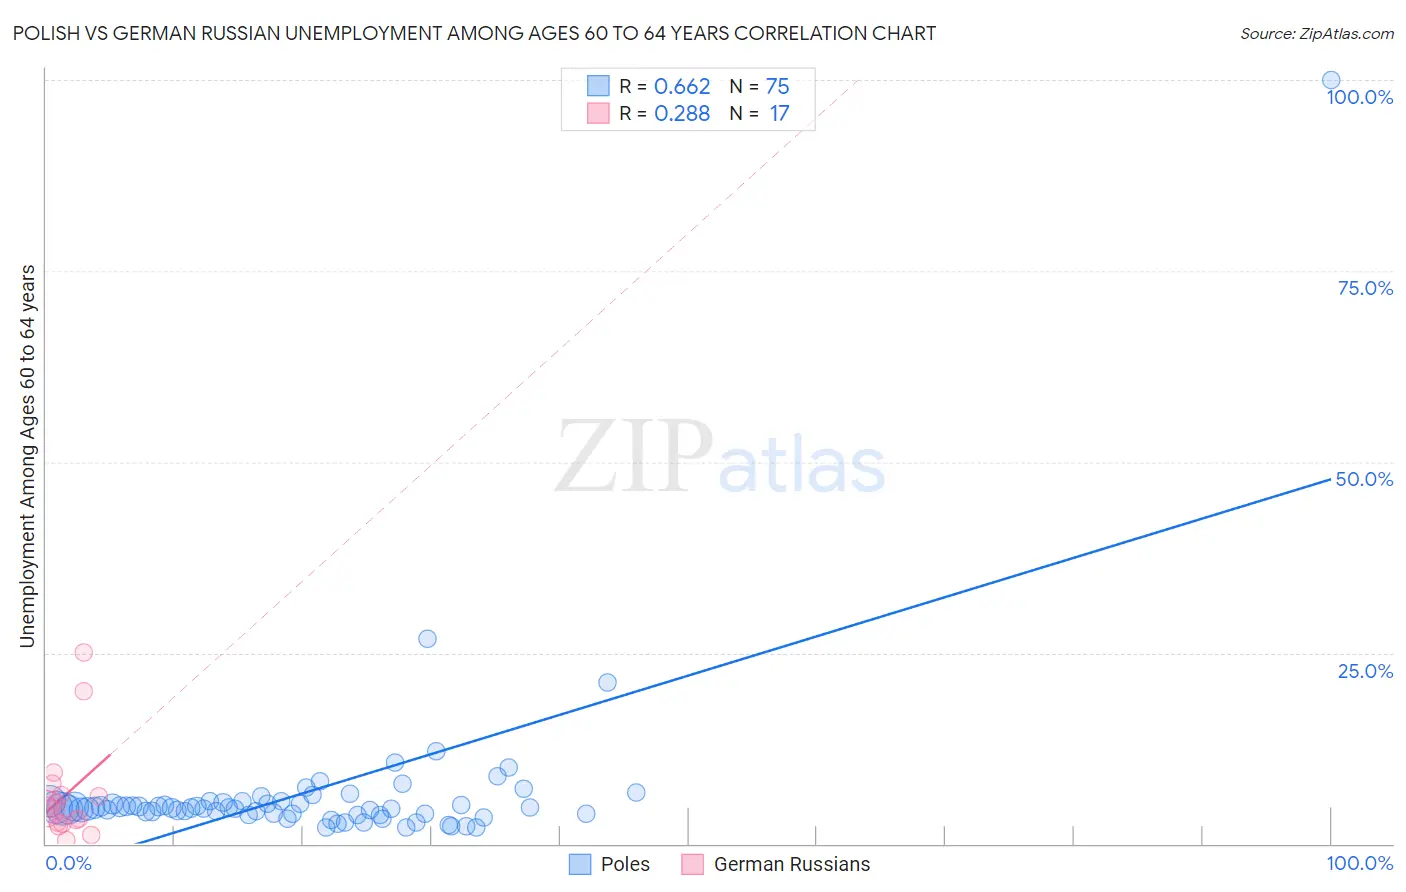
Polish vs German Russian Unemployment Among Ages 60 to 64 years Correlation Chart
The statistical analysis conducted on geographies consisting of 461,022,460 people shows a significant positive correlation between the proportion of Poles and unemployment rate among population between the ages 60 and 64 in the United States with a correlation coefficient (R) of 0.662 and weighted average of 4.7%. Similarly, the statistical analysis conducted on geographies consisting of 92,139,052 people shows a weak positive correlation between the proportion of German Russians and unemployment rate among population between the ages 60 and 64 in the United States with a correlation coefficient (R) of 0.288 and weighted average of 4.9%, a difference of 5.1%.
Unemployment Among Ages 60 to 64 years Correlation Summary
| Measurement | Polish | German Russian |
| Minimum | 2.1% | 0.50% |
| Maximum | 100.0% | 25.0% |
| Range | 97.9% | 24.5% |
| Mean | 6.6% | 6.5% |
| Median | 4.7% | 4.6% |
| Interquartile 25% (IQ1) | 3.9% | 2.7% |
| Interquartile 75% (IQ3) | 5.5% | 7.1% |
| Interquartile Range (IQR) | 1.6% | 4.4% |
| Standard Deviation (Sample) | 11.5% | 6.5% |
| Standard Deviation (Population) | 11.4% | 6.3% |
Similar Demographics by Unemployment Among Ages 60 to 64 years
Demographics Similar to Poles by Unemployment Among Ages 60 to 64 years
In terms of unemployment among ages 60 to 64 years, the demographic groups most similar to Poles are Serbian (4.7%, a difference of 0.010%), Immigrants from Kuwait (4.7%, a difference of 0.090%), Immigrants from Albania (4.7%, a difference of 0.090%), Somali (4.7%, a difference of 0.090%), and Egyptian (4.7%, a difference of 0.090%).
| Demographics | Rating | Rank | Unemployment Among Ages 60 to 64 years |
| Immigrants | Northern Africa | 98.7 /100 | #89 | Exceptional 4.7% |
| Immigrants | Liberia | 98.7 /100 | #90 | Exceptional 4.7% |
| Immigrants | Uganda | 98.4 /100 | #91 | Exceptional 4.7% |
| Romanians | 98.4 /100 | #92 | Exceptional 4.7% |
| Immigrants | Saudi Arabia | 98.3 /100 | #93 | Exceptional 4.7% |
| Immigrants | Kuwait | 98.3 /100 | #94 | Exceptional 4.7% |
| Serbians | 98.2 /100 | #95 | Exceptional 4.7% |
| Poles | 98.1 /100 | #96 | Exceptional 4.7% |
| Immigrants | Albania | 98.0 /100 | #97 | Exceptional 4.7% |
| Somalis | 98.0 /100 | #98 | Exceptional 4.7% |
| Egyptians | 98.0 /100 | #99 | Exceptional 4.7% |
| Portuguese | 97.9 /100 | #100 | Exceptional 4.7% |
| Malaysians | 97.9 /100 | #101 | Exceptional 4.7% |
| Immigrants | Canada | 97.8 /100 | #102 | Exceptional 4.7% |
| Whites/Caucasians | 97.8 /100 | #103 | Exceptional 4.7% |
Demographics Similar to German Russians by Unemployment Among Ages 60 to 64 years
In terms of unemployment among ages 60 to 64 years, the demographic groups most similar to German Russians are Sierra Leonean (4.9%, a difference of 0.010%), Chippewa (4.9%, a difference of 0.030%), Immigrants from Indonesia (4.9%, a difference of 0.040%), New Zealander (4.9%, a difference of 0.040%), and Cherokee (4.9%, a difference of 0.040%).
| Demographics | Rating | Rank | Unemployment Among Ages 60 to 64 years |
| Colombians | 22.7 /100 | #201 | Fair 4.9% |
| Immigrants | Western Africa | 20.6 /100 | #202 | Fair 4.9% |
| Uruguayans | 19.9 /100 | #203 | Poor 4.9% |
| Russians | 18.9 /100 | #204 | Poor 4.9% |
| Immigrants | Indonesia | 17.4 /100 | #205 | Poor 4.9% |
| New Zealanders | 17.4 /100 | #206 | Poor 4.9% |
| Chippewa | 17.3 /100 | #207 | Poor 4.9% |
| German Russians | 16.8 /100 | #208 | Poor 4.9% |
| Sierra Leoneans | 16.5 /100 | #209 | Poor 4.9% |
| Cherokee | 16.1 /100 | #210 | Poor 4.9% |
| Blackfeet | 15.7 /100 | #211 | Poor 4.9% |
| Moroccans | 15.0 /100 | #212 | Poor 4.9% |
| Eastern Europeans | 14.3 /100 | #213 | Poor 4.9% |
| Immigrants | Russia | 13.7 /100 | #214 | Poor 4.9% |
| Immigrants | South Eastern Asia | 13.1 /100 | #215 | Poor 4.9% |