Peruvian vs Immigrants from Ukraine Unemployment Among Ages 25 to 29 years

COMPARE

Peruvian
Race
Ancestry
AfghanAfricanAlaska NativeAlaskan AthabascanAlbanianAleutAlsatianAmericanApacheArabArapahoArgentineanArmenianAssyrian/Chaldean/SyriacAustralianAustrianBahamianBangladeshiBarbadianBasqueBelgianBelizeanBermudanBhutaneseBlackfeetBolivianBrazilianBritishBritish West IndianBulgarianBurmeseCajunCambodianCanadianCape VerdeanCarpatho RusynCelticCentral AmericanCentral American IndianCherokeeCheyenneChickasawChileanChineseChippewaChoctawColombianColvilleComancheCosta RicanCreeCreekCroatianCrowCubanCypriotCzechCzechoslovakianDanishDelawareDominicanDutchDutch West IndianEastern EuropeanEcuadorianEgyptianEnglishEstonianEthiopianEuropeanFijianFilipinoFinnishFrenchFrench American IndianFrench CanadianGermanGerman RussianGhanaianGreekGuamanian/ChamorroGuatemalanGuyaneseHaitianHmongHonduranHopiHoumaHungarianIcelanderIndian (Asian)IndonesianInupiatIranianIraqiIrishIroquoisIsraeliItalianJamaicanJapaneseJordanianKenyanKiowaKoreanLaotianLatvianLebaneseLiberianLithuanianLumbeeLuxembourgerMacedonianMalaysianMalteseMarshalleseMenomineeMexicanMexican American IndianMongolianMoroccanNative HawaiianNavajoNepaleseNew ZealanderNicaraguanNigerianNorthern EuropeanNorwegianOkinawanOsageOttawaPaiutePakistaniPalestinianPanamanianParaguayanPennsylvania GermanPeruvianPimaPolishPortuguesePotawatomiPuebloPuerto RicanPuget Sound SalishRomanianRussianSalvadoranSamoanScandinavianScotch-IrishScottishSeminoleSenegaleseSerbianShoshoneSierra LeoneanSiouxSlavicSlovakSloveneSomaliSouth AfricanSouth AmericanSouth American IndianSoviet UnionSpaniardSpanishSpanish AmericanSpanish American IndianSri LankanSubsaharan AfricanSudaneseSwedishSwissSyrianTaiwaneseThaiTlingit-HaidaTohono O'OdhamTonganTrinidadian and TobagonianTsimshianTurkishU.S. Virgin IslanderUgandanUkrainianUruguayanUteVenezuelanVietnameseWelshWest IndianYakamaYaquiYugoslavianYumanYup'ikZimbabwean
Immigration
NonimmigrantsImmigrantsAfghanistanAfricaAlbaniaArgentinaArmeniaAsiaAustraliaAustriaBahamasBangladeshBarbadosBelarusBelgiumBelizeBoliviaBosnia and HerzegovinaBrazilBulgariaBurma/MyanmarCabo VerdeCambodiaCameroonCanadaCaribbeanCentral AmericaChileChinaColombiaCongoCosta RicaCroatiaCubaCzechoslovakiaDenmarkDominicaDominican RepublicEastern AfricaEastern AsiaEastern EuropeEcuadorEgyptEl SalvadorEnglandEritreaEthiopiaEuropeFijiFranceGermanyGhanaGreeceGrenadaGuatemalaGuyanaHaitiHondurasHong KongHungaryIndiaIndonesiaIranIraqIrelandIsraelItalyJamaicaJapanJordanKazakhstanKenyaKoreaKuwaitLaosLatin AmericaLatviaLebanonLiberiaLithuaniaMalaysiaMexicoMicronesiaMiddle AfricaMoldovaMoroccoNepalNetherlandsNicaraguaNigeriaNorth AmericaNorth MacedoniaNorthern AfricaNorthern EuropeNorwayOceaniaPakistanPanamaPeruPhilippinesPolandPortugalRomaniaRussiaSaudi ArabiaScotlandSenegalSerbiaSierra LeoneSingaporeSomaliaSouth AfricaSouth AmericaSouth Central AsiaSouth Eastern AsiaSouthern EuropeSpainSri LankaSt. Vincent and the GrenadinesSudanSwedenSwitzerlandSyriaTaiwanThailandTrinidad and TobagoTurkeyUgandaUruguayUzbekistanVenezuelaVietnamWest IndiesWestern AfricaWestern AsiaWestern EuropeYemenZaireZimbabweAzores
Immigrants from Ukraine
Race
Ancestry
AfghanAfricanAlaska NativeAlaskan AthabascanAlbanianAleutAlsatianAmericanApacheArabArapahoArgentineanArmenianAssyrian/Chaldean/SyriacAustralianAustrianBahamianBangladeshiBarbadianBasqueBelgianBelizeanBermudanBhutaneseBlackfeetBolivianBrazilianBritishBritish West IndianBulgarianBurmeseCajunCambodianCanadianCape VerdeanCarpatho RusynCelticCentral AmericanCentral American IndianCherokeeCheyenneChickasawChileanChineseChippewaChoctawColombianColvilleComancheCosta RicanCreeCreekCroatianCrowCubanCypriotCzechCzechoslovakianDanishDelawareDominicanDutchDutch West IndianEastern EuropeanEcuadorianEgyptianEnglishEstonianEthiopianEuropeanFijianFilipinoFinnishFrenchFrench American IndianFrench CanadianGermanGerman RussianGhanaianGreekGuamanian/ChamorroGuatemalanGuyaneseHaitianHmongHonduranHopiHoumaHungarianIcelanderIndian (Asian)IndonesianInupiatIranianIraqiIrishIroquoisIsraeliItalianJamaicanJapaneseJordanianKenyanKiowaKoreanLaotianLatvianLebaneseLiberianLithuanianLumbeeLuxembourgerMacedonianMalaysianMalteseMarshalleseMenomineeMexicanMexican American IndianMongolianMoroccanNative HawaiianNavajoNepaleseNew ZealanderNicaraguanNigerianNorthern EuropeanNorwegianOkinawanOsageOttawaPaiutePakistaniPalestinianPanamanianParaguayanPennsylvania GermanPimaPolishPortuguesePotawatomiPuebloPuerto RicanPuget Sound SalishRomanianRussianSalvadoranSamoanScandinavianScotch-IrishScottishSeminoleSenegaleseSerbianShoshoneSierra LeoneanSiouxSlavicSlovakSloveneSomaliSouth AfricanSouth AmericanSouth American IndianSoviet UnionSpaniardSpanishSpanish AmericanSpanish American IndianSri LankanSubsaharan AfricanSudaneseSwedishSwissSyrianTaiwaneseThaiTlingit-HaidaTohono O'OdhamTonganTrinidadian and TobagonianTsimshianTurkishU.S. Virgin IslanderUgandanUkrainianUruguayanUteVenezuelanVietnameseWelshWest IndianYakamaYaquiYugoslavianYumanYup'ikZimbabwean
Immigration
NonimmigrantsImmigrantsAfghanistanAfricaAlbaniaArgentinaArmeniaAsiaAustraliaAustriaBahamasBangladeshBarbadosBelarusBelgiumBelizeBoliviaBosnia and HerzegovinaBrazilBulgariaBurma/MyanmarCabo VerdeCambodiaCameroonCanadaCaribbeanCentral AmericaChileChinaColombiaCongoCosta RicaCroatiaCubaCzechoslovakiaDenmarkDominicaDominican RepublicEastern AfricaEastern AsiaEastern EuropeEcuadorEgyptEl SalvadorEnglandEritreaEthiopiaEuropeFijiFranceGermanyGhanaGreeceGrenadaGuatemalaGuyanaHaitiHondurasHong KongHungaryIndiaIndonesiaIranIraqIrelandIsraelItalyJamaicaJapanJordanKazakhstanKenyaKoreaKuwaitLaosLatin AmericaLatviaLebanonLiberiaLithuaniaMalaysiaMexicoMicronesiaMiddle AfricaMoldovaMoroccoNepalNetherlandsNicaraguaNigeriaNorth AmericaNorth MacedoniaNorthern AfricaNorthern EuropeNorwayOceaniaPakistanPanamaPeruPhilippinesPolandPortugalRomaniaRussiaSaudi ArabiaScotlandSenegalSerbiaSierra LeoneSingaporeSomaliaSouth AfricaSouth AmericaSouth Central AsiaSouth Eastern AsiaSouthern EuropeSpainSri LankaSt. Vincent and the GrenadinesSudanSwedenSwitzerlandSyriaTaiwanThailandTrinidad and TobagoTurkeyUgandaUkraineUruguayUzbekistanVenezuelaVietnamWest IndiesWestern AfricaWestern AsiaWestern EuropeYemenZaireZimbabweAzores
Unemployment Among Ages 25 to 29 years
Income
Poverty
Unemployment
Labor Participation
Family Structure
Vehicle Availability
Education Level
Disability

Unemployment Among Ages 25 to 29 years Comparison

Peruvians

Immigrants from Ukraine

Good
Fair
6.6%
UNEMPLOYMENT AMONG AGES 25 TO 29 YEARS
68.1/ 100
METRIC RATING
148th/ 347
METRIC RANK
6.7%
UNEMPLOYMENT AMONG AGES 25 TO 29 YEARS
28.6/ 100
METRIC RATING
192nd/ 347
METRIC RANK

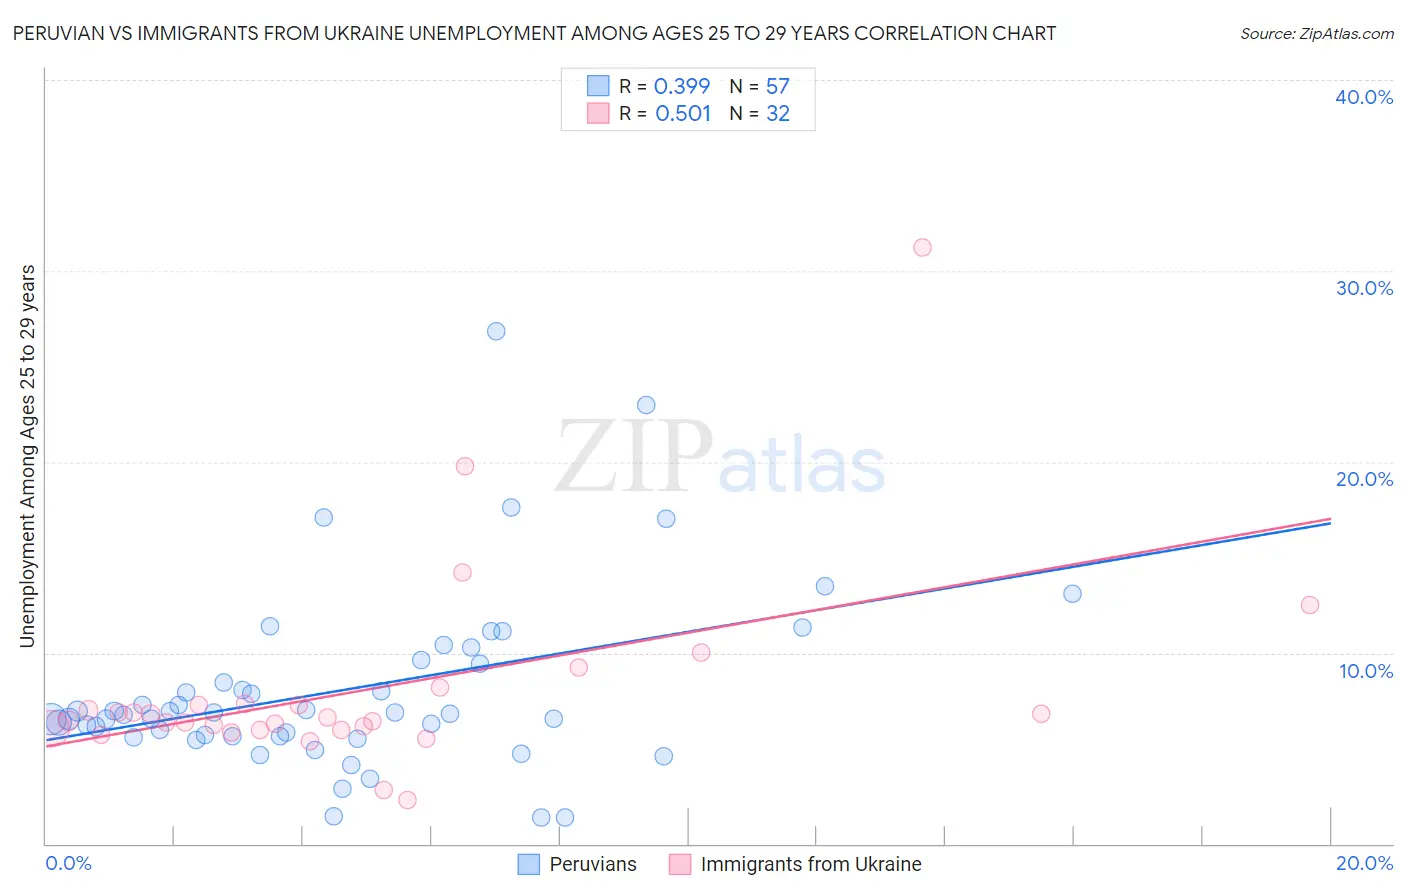
Peruvian vs Immigrants from Ukraine Unemployment Among Ages 25 to 29 years Correlation Chart

The statistical analysis conducted on geographies consisting of 349,637,012 people shows a mild positive correlation between the proportion of Peruvians and unemployment rate among population between the ages 25 and 29 in the United States with a correlation coefficient (R) of 0.399 and weighted average of 6.6%. Similarly, the statistical analysis conducted on geographies consisting of 279,034,601 people shows a substantial positive correlation between the proportion of Immigrants from Ukraine and unemployment rate among population between the ages 25 and 29 in the United States with a correlation coefficient (R) of 0.501 and weighted average of 6.7%, a difference of 2.6%.
Peruvian vs Immigrants from Ukraine Unemployment Among Ages 25 to 29 years

Unemployment Among Ages 25 to 29 years Correlation Summary

MeasurementPeruvianImmigrants from Ukraine
Minimum1.4%2.3%
Maximum26.8%31.2%
Range25.4%28.9%
Mean8.1%8.0%
Median6.8%6.5%
Interquartile 25% (IQ1)5.7%6.0%
Interquartile 75% (IQ3)9.5%7.3%
Interquartile Range (IQR)3.9%1.3%
Standard Deviation (Sample)4.7%5.3%
Standard Deviation (Population)4.7%5.2%

Similar Demographics by Unemployment Among Ages 25 to 29 years

Demographics Similar to Peruvians by Unemployment Among Ages 25 to 29 years

In terms of unemployment among ages 25 to 29 years, the demographic groups most similar to Peruvians are Immigrants from Thailand (6.6%, a difference of 0.020%), Malaysian (6.6%, a difference of 0.070%), Finnish (6.6%, a difference of 0.080%), Romanian (6.6%, a difference of 0.10%), and Nicaraguan (6.6%, a difference of 0.15%).
DemographicsRating | RankUnemployment Among Ages 25 to 29 years
Maltese
72.9
/100
|
#141
Good
6.5%
Slavs
72.5
/100
|
#142
Good
6.5%
Lithuanians
72.2
/100
|
#143
Good
6.5%
Immigrants | Micronesia
71.5
/100
|
#144
Good
6.6%
Nicaraguans
70.2
/100
|
#145
Good
6.6%
Romanians
69.5
/100
|
#146
Good
6.6%
Immigrants | Thailand
68.4
/100
|
#147
Good
6.6%
Peruvians
68.1
/100
|
#148
Good
6.6%
Malaysians
67.1
/100
|
#149
Good
6.6%
Finns
66.9
/100
|
#150
Good
6.6%
Ukrainians
65.5
/100
|
#151
Good
6.6%
Samoans
64.6
/100
|
#152
Good
6.6%
Immigrants | Italy
64.4
/100
|
#153
Good
6.6%
Colombians
64.0
/100
|
#154
Good
6.6%
Immigrants | Latvia
63.9
/100
|
#155
Good
6.6%

Demographics Similar to Immigrants from Ukraine by Unemployment Among Ages 25 to 29 years

In terms of unemployment among ages 25 to 29 years, the demographic groups most similar to Immigrants from Ukraine are Chickasaw (6.7%, a difference of 0.010%), Alsatian (6.7%, a difference of 0.040%), Immigrants from Greece (6.7%, a difference of 0.040%), Korean (6.7%, a difference of 0.050%), and Immigrants from Western Asia (6.7%, a difference of 0.10%).
DemographicsRating | RankUnemployment Among Ages 25 to 29 years
Moroccans
35.9
/100
|
#185
Fair
6.7%
Immigrants | Iran
34.4
/100
|
#186
Fair
6.7%
Immigrants | South America
33.0
/100
|
#187
Fair
6.7%
Irish
32.8
/100
|
#188
Fair
6.7%
Argentineans
32.1
/100
|
#189
Fair
6.7%
Koreans
29.3
/100
|
#190
Fair
6.7%
Chickasaw
28.7
/100
|
#191
Fair
6.7%
Immigrants | Ukraine
28.6
/100
|
#192
Fair
6.7%
Alsatians
28.1
/100
|
#193
Fair
6.7%
Immigrants | Greece
28.0
/100
|
#194
Fair
6.7%
Immigrants | Western Asia
27.3
/100
|
#195
Fair
6.7%
Hungarians
26.8
/100
|
#196
Fair
6.8%
Italians
26.5
/100
|
#197
Fair
6.8%
Immigrants | Southern Europe
24.6
/100
|
#198
Fair
6.8%
Guamanians/Chamorros
24.3
/100
|
#199
Fair
6.8%