Peruvian vs Immigrants from Bangladesh Female Unemployment
COMPARE
Peruvian
Immigrants from Bangladesh
Female Unemployment
Female Unemployment Comparison
Peruvians
Immigrants from Bangladesh
5.4%
FEMALE UNEMPLOYMENT
9.6/ 100
METRIC RATING
217th/ 347
METRIC RANK
6.5%
FEMALE UNEMPLOYMENT
0.0/ 100
METRIC RATING
319th/ 347
METRIC RANK
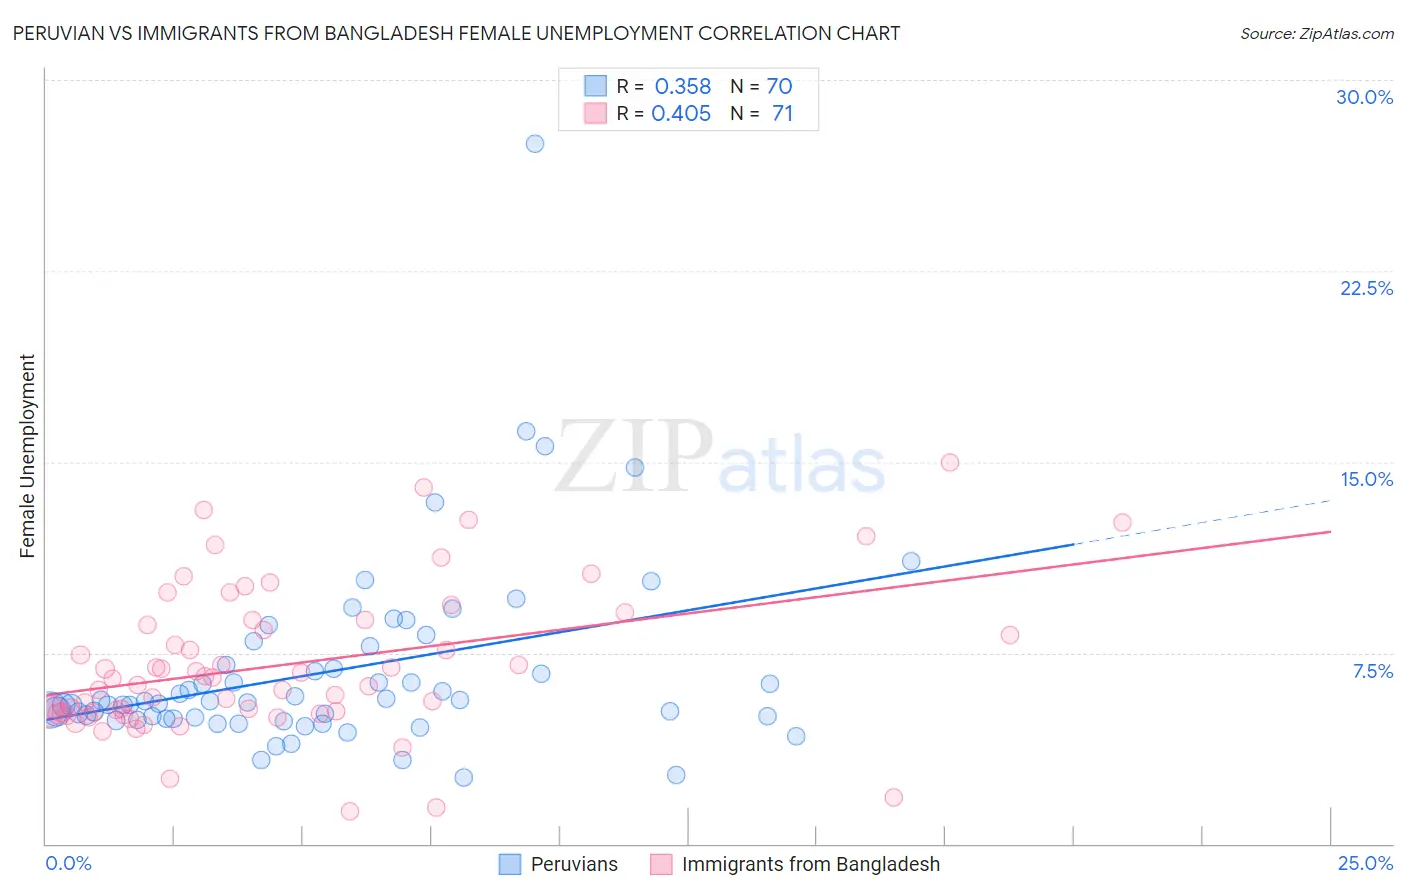
Peruvian vs Immigrants from Bangladesh Female Unemployment Correlation Chart
The statistical analysis conducted on geographies consisting of 362,221,482 people shows a mild positive correlation between the proportion of Peruvians and unemploymnet rate among females in the United States with a correlation coefficient (R) of 0.358 and weighted average of 5.4%. Similarly, the statistical analysis conducted on geographies consisting of 203,458,285 people shows a moderate positive correlation between the proportion of Immigrants from Bangladesh and unemploymnet rate among females in the United States with a correlation coefficient (R) of 0.405 and weighted average of 6.5%, a difference of 18.8%.
Female Unemployment Correlation Summary
| Measurement | Peruvian | Immigrants from Bangladesh |
| Minimum | 2.6% | 1.3% |
| Maximum | 27.5% | 15.0% |
| Range | 24.9% | 13.7% |
| Mean | 6.8% | 7.0% |
| Median | 5.6% | 6.5% |
| Interquartile 25% (IQ1) | 4.9% | 5.1% |
| Interquartile 75% (IQ3) | 7.0% | 8.8% |
| Interquartile Range (IQR) | 2.1% | 3.7% |
| Standard Deviation (Sample) | 3.7% | 2.9% |
| Standard Deviation (Population) | 3.7% | 2.9% |
Similar Demographics by Female Unemployment
Demographics Similar to Peruvians by Female Unemployment
In terms of female unemployment, the demographic groups most similar to Peruvians are Comanche (5.4%, a difference of 0.070%), Immigrants from Nicaragua (5.4%, a difference of 0.10%), Bermudan (5.4%, a difference of 0.10%), Seminole (5.4%, a difference of 0.12%), and Samoan (5.4%, a difference of 0.17%).
| Demographics | Rating | Rank | Female Unemployment |
| Choctaw | 12.3 /100 | #210 | Poor 5.4% |
| Ottawa | 11.6 /100 | #211 | Poor 5.4% |
| Uruguayans | 11.4 /100 | #212 | Poor 5.4% |
| Samoans | 10.6 /100 | #213 | Poor 5.4% |
| Seminole | 10.3 /100 | #214 | Poor 5.4% |
| Immigrants | Nicaragua | 10.2 /100 | #215 | Poor 5.4% |
| Comanche | 10.0 /100 | #216 | Poor 5.4% |
| Peruvians | 9.6 /100 | #217 | Tragic 5.4% |
| Bermudans | 9.0 /100 | #218 | Tragic 5.4% |
| South Americans | 8.6 /100 | #219 | Tragic 5.4% |
| Immigrants | Africa | 8.5 /100 | #220 | Tragic 5.4% |
| Brazilians | 7.3 /100 | #221 | Tragic 5.5% |
| Nicaraguans | 7.2 /100 | #222 | Tragic 5.5% |
| Delaware | 7.2 /100 | #223 | Tragic 5.5% |
| Iraqis | 7.1 /100 | #224 | Tragic 5.5% |
Demographics Similar to Immigrants from Bangladesh by Female Unemployment
In terms of female unemployment, the demographic groups most similar to Immigrants from Bangladesh are Immigrants from Dominica (6.5%, a difference of 0.010%), British West Indian (6.4%, a difference of 0.19%), Immigrants from St. Vincent and the Grenadines (6.4%, a difference of 0.47%), Black/African American (6.5%, a difference of 0.55%), and Vietnamese (6.5%, a difference of 0.63%).
| Demographics | Rating | Rank | Female Unemployment |
| Immigrants | Grenada | 0.0 /100 | #312 | Tragic 6.3% |
| Belizeans | 0.0 /100 | #313 | Tragic 6.3% |
| Immigrants | Ecuador | 0.0 /100 | #314 | Tragic 6.4% |
| Pueblo | 0.0 /100 | #315 | Tragic 6.4% |
| Houma | 0.0 /100 | #316 | Tragic 6.4% |
| Immigrants | St. Vincent and the Grenadines | 0.0 /100 | #317 | Tragic 6.4% |
| British West Indians | 0.0 /100 | #318 | Tragic 6.4% |
| Immigrants | Bangladesh | 0.0 /100 | #319 | Tragic 6.5% |
| Immigrants | Dominica | 0.0 /100 | #320 | Tragic 6.5% |
| Blacks/African Americans | 0.0 /100 | #321 | Tragic 6.5% |
| Vietnamese | 0.0 /100 | #322 | Tragic 6.5% |
| Immigrants | Belize | 0.0 /100 | #323 | Tragic 6.5% |
| Cheyenne | 0.0 /100 | #324 | Tragic 6.6% |
| Apache | 0.0 /100 | #325 | Tragic 6.6% |
| Natives/Alaskans | 0.0 /100 | #326 | Tragic 6.6% |