Peruvian vs Creek Unemployment Among Ages 20 to 24 years
COMPARE
Peruvian
Creek
Unemployment Among Ages 20 to 24 years
Unemployment Among Ages 20 to 24 years Comparison
Peruvians
Creek
10.5%
UNEMPLOYMENT AMONG AGES 20 TO 24 YEARS
17.2/ 100
METRIC RATING
209th/ 347
METRIC RANK
9.7%
UNEMPLOYMENT AMONG AGES 20 TO 24 YEARS
99.8/ 100
METRIC RATING
49th/ 347
METRIC RANK
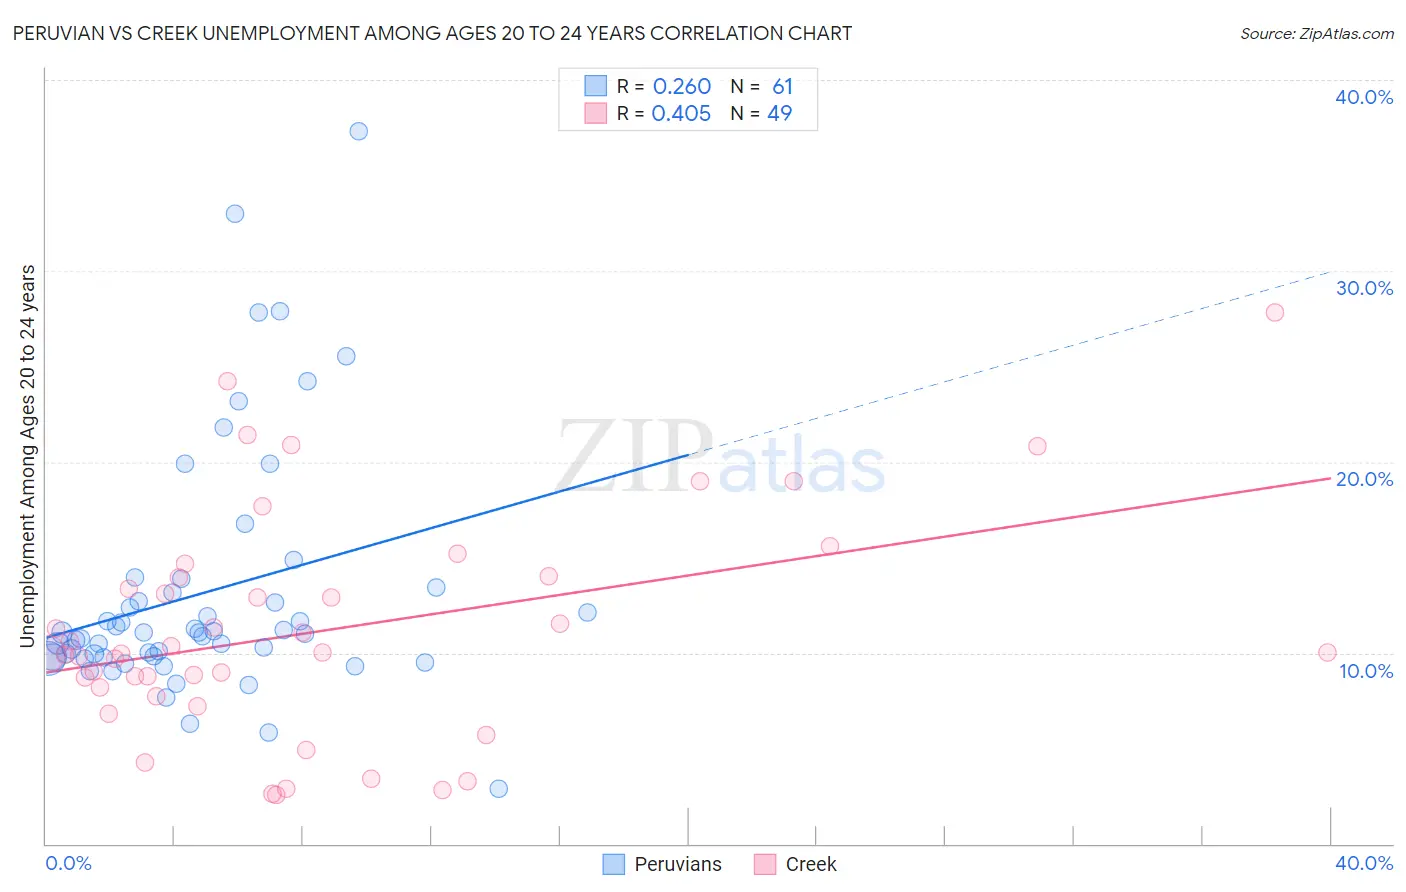
Peruvian vs Creek Unemployment Among Ages 20 to 24 years Correlation Chart
The statistical analysis conducted on geographies consisting of 355,365,601 people shows a weak positive correlation between the proportion of Peruvians and unemployment rate among population between the ages 20 and 24 in the United States with a correlation coefficient (R) of 0.260 and weighted average of 10.5%. Similarly, the statistical analysis conducted on geographies consisting of 174,635,807 people shows a moderate positive correlation between the proportion of Creek and unemployment rate among population between the ages 20 and 24 in the United States with a correlation coefficient (R) of 0.405 and weighted average of 9.7%, a difference of 7.4%.
Unemployment Among Ages 20 to 24 years Correlation Summary
| Measurement | Peruvian | Creek |
| Minimum | 2.9% | 2.5% |
| Maximum | 37.3% | 27.8% |
| Range | 34.4% | 25.3% |
| Mean | 13.1% | 11.2% |
| Median | 11.1% | 10.0% |
| Interquartile 25% (IQ1) | 9.8% | 8.0% |
| Interquartile 75% (IQ3) | 13.3% | 14.0% |
| Interquartile Range (IQR) | 3.5% | 6.0% |
| Standard Deviation (Sample) | 6.5% | 5.8% |
| Standard Deviation (Population) | 6.4% | 5.7% |
Similar Demographics by Unemployment Among Ages 20 to 24 years
Demographics Similar to Peruvians by Unemployment Among Ages 20 to 24 years
In terms of unemployment among ages 20 to 24 years, the demographic groups most similar to Peruvians are Immigrants from Belgium (10.5%, a difference of 0.020%), Immigrants from Hong Kong (10.5%, a difference of 0.030%), Immigrants from Honduras (10.4%, a difference of 0.050%), Immigrants from Europe (10.4%, a difference of 0.080%), and Cypriot (10.4%, a difference of 0.11%).
| Demographics | Rating | Rank | Unemployment Among Ages 20 to 24 years |
| Immigrants | Middle Africa | 20.9 /100 | #202 | Fair 10.4% |
| South Americans | 20.6 /100 | #203 | Fair 10.4% |
| Immigrants | Northern Europe | 19.5 /100 | #204 | Poor 10.4% |
| Cypriots | 18.9 /100 | #205 | Poor 10.4% |
| Immigrants | Europe | 18.5 /100 | #206 | Poor 10.4% |
| Immigrants | Honduras | 17.9 /100 | #207 | Poor 10.4% |
| Immigrants | Hong Kong | 17.6 /100 | #208 | Poor 10.5% |
| Peruvians | 17.2 /100 | #209 | Poor 10.5% |
| Immigrants | Belgium | 16.9 /100 | #210 | Poor 10.5% |
| Immigrants | Guatemala | 14.6 /100 | #211 | Poor 10.5% |
| Immigrants | Sri Lanka | 14.0 /100 | #212 | Poor 10.5% |
| Guatemalans | 12.2 /100 | #213 | Poor 10.5% |
| Kiowa | 11.7 /100 | #214 | Poor 10.5% |
| Hondurans | 10.5 /100 | #215 | Poor 10.5% |
| Costa Ricans | 9.6 /100 | #216 | Tragic 10.5% |
Demographics Similar to Creek by Unemployment Among Ages 20 to 24 years
In terms of unemployment among ages 20 to 24 years, the demographic groups most similar to Creek are Finnish (9.7%, a difference of 0.080%), Immigrants from India (9.7%, a difference of 0.090%), Immigrants from Kenya (9.7%, a difference of 0.14%), Immigrants from Nicaragua (9.7%, a difference of 0.21%), and Ethiopian (9.8%, a difference of 0.21%).
| Demographics | Rating | Rank | Unemployment Among Ages 20 to 24 years |
| Immigrants | Saudi Arabia | 99.9 /100 | #42 | Exceptional 9.7% |
| Menominee | 99.8 /100 | #43 | Exceptional 9.7% |
| Europeans | 99.8 /100 | #44 | Exceptional 9.7% |
| Croatians | 99.8 /100 | #45 | Exceptional 9.7% |
| Immigrants | Nicaragua | 99.8 /100 | #46 | Exceptional 9.7% |
| Immigrants | India | 99.8 /100 | #47 | Exceptional 9.7% |
| Finns | 99.8 /100 | #48 | Exceptional 9.7% |
| Creek | 99.8 /100 | #49 | Exceptional 9.7% |
| Immigrants | Kenya | 99.7 /100 | #50 | Exceptional 9.7% |
| Ethiopians | 99.7 /100 | #51 | Exceptional 9.8% |
| Immigrants | Thailand | 99.7 /100 | #52 | Exceptional 9.8% |
| Immigrants | Serbia | 99.6 /100 | #53 | Exceptional 9.8% |
| Immigrants | Cambodia | 99.6 /100 | #54 | Exceptional 9.8% |
| Carpatho Rusyns | 99.6 /100 | #55 | Exceptional 9.8% |
| Nicaraguans | 99.6 /100 | #56 | Exceptional 9.8% |