Pennsylvania German vs Osage Unemployment Among Ages 20 to 24 years
COMPARE
Pennsylvania German
Osage
Unemployment Among Ages 20 to 24 years
Unemployment Among Ages 20 to 24 years Comparison
Pennsylvania Germans
Osage
10.0%
UNEMPLOYMENT AMONG AGES 20 TO 24 YEARS
93.9/ 100
METRIC RATING
106th/ 347
METRIC RANK
9.4%
UNEMPLOYMENT AMONG AGES 20 TO 24 YEARS
100.0/ 100
METRIC RATING
20th/ 347
METRIC RANK
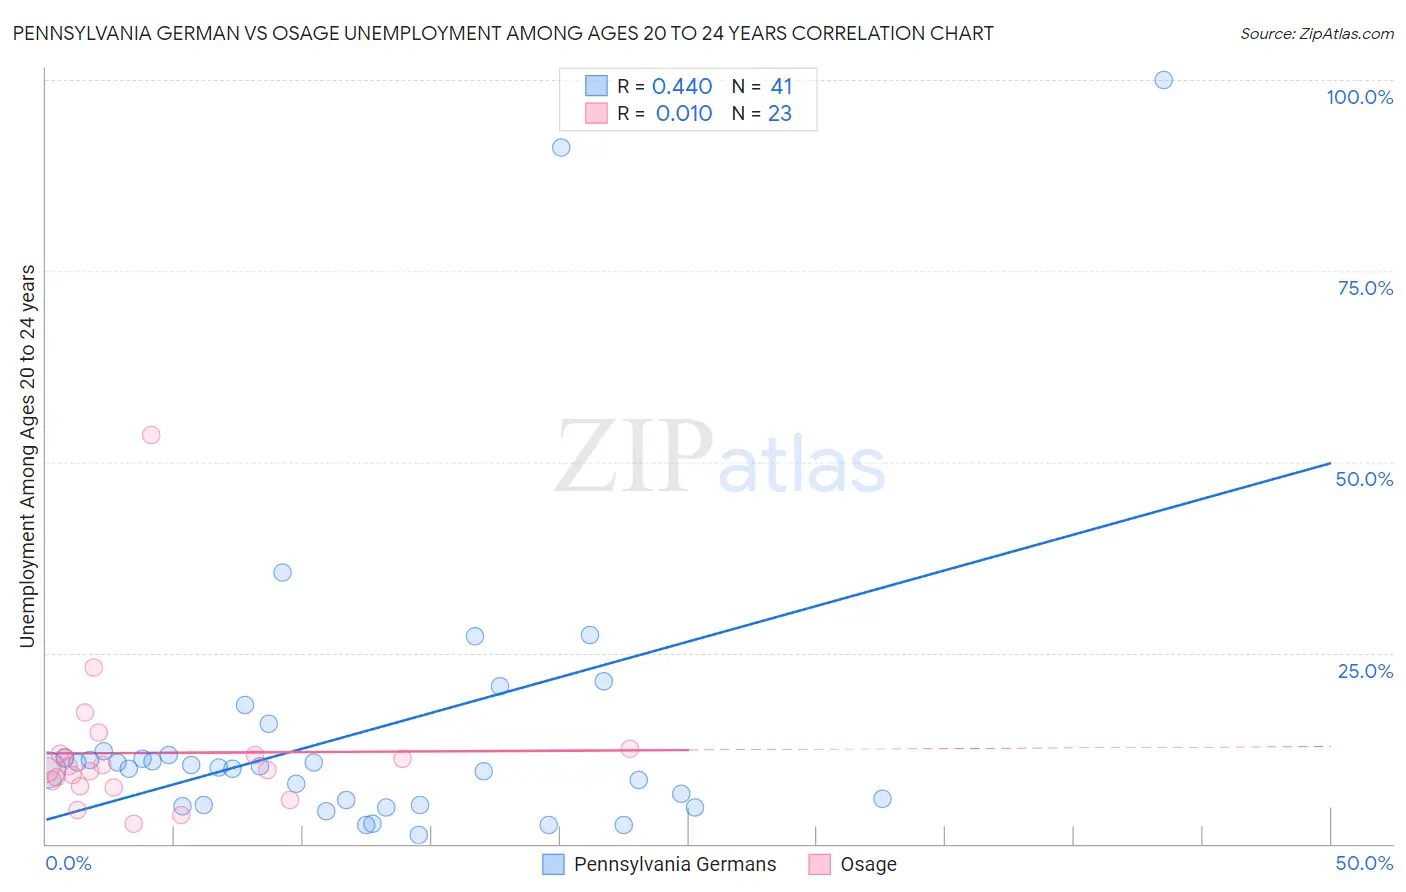
Pennsylvania German vs Osage Unemployment Among Ages 20 to 24 years Correlation Chart
The statistical analysis conducted on geographies consisting of 225,394,343 people shows a moderate positive correlation between the proportion of Pennsylvania Germans and unemployment rate among population between the ages 20 and 24 in the United States with a correlation coefficient (R) of 0.440 and weighted average of 10.0%. Similarly, the statistical analysis conducted on geographies consisting of 90,596,996 people shows no correlation between the proportion of Osage and unemployment rate among population between the ages 20 and 24 in the United States with a correlation coefficient (R) of 0.010 and weighted average of 9.4%, a difference of 7.1%.
Unemployment Among Ages 20 to 24 years Correlation Summary
| Measurement | Pennsylvania German | Osage |
| Minimum | 1.1% | 2.6% |
| Maximum | 100.0% | 53.6% |
| Range | 98.9% | 51.0% |
| Mean | 14.6% | 11.9% |
| Median | 10.0% | 9.7% |
| Interquartile 25% (IQ1) | 5.1% | 7.5% |
| Interquartile 75% (IQ3) | 11.8% | 11.7% |
| Interquartile Range (IQR) | 6.7% | 4.2% |
| Standard Deviation (Sample) | 20.0% | 10.1% |
| Standard Deviation (Population) | 19.7% | 9.9% |
Similar Demographics by Unemployment Among Ages 20 to 24 years
Demographics Similar to Pennsylvania Germans by Unemployment Among Ages 20 to 24 years
In terms of unemployment among ages 20 to 24 years, the demographic groups most similar to Pennsylvania Germans are Immigrants from Hungary (10.0%, a difference of 0.020%), Immigrants from Chile (10.0%, a difference of 0.030%), Irish (10.0%, a difference of 0.070%), Iroquois (10.1%, a difference of 0.070%), and Immigrants from Latvia (10.1%, a difference of 0.10%).
| Demographics | Rating | Rank | Unemployment Among Ages 20 to 24 years |
| Fijians | 95.3 /100 | #99 | Exceptional 10.0% |
| Immigrants | France | 95.2 /100 | #100 | Exceptional 10.0% |
| Laotians | 95.1 /100 | #101 | Exceptional 10.0% |
| Immigrants | Argentina | 94.9 /100 | #102 | Exceptional 10.0% |
| Irish | 94.3 /100 | #103 | Exceptional 10.0% |
| Immigrants | Chile | 94.0 /100 | #104 | Exceptional 10.0% |
| Immigrants | Hungary | 94.0 /100 | #105 | Exceptional 10.0% |
| Pennsylvania Germans | 93.9 /100 | #106 | Exceptional 10.0% |
| Iroquois | 93.4 /100 | #107 | Exceptional 10.1% |
| Immigrants | Latvia | 93.2 /100 | #108 | Exceptional 10.1% |
| Filipinos | 93.2 /100 | #109 | Exceptional 10.1% |
| Immigrants | Spain | 93.1 /100 | #110 | Exceptional 10.1% |
| Immigrants | Indonesia | 92.7 /100 | #111 | Exceptional 10.1% |
| Northern Europeans | 92.7 /100 | #112 | Exceptional 10.1% |
| German Russians | 92.4 /100 | #113 | Exceptional 10.1% |
Demographics Similar to Osage by Unemployment Among Ages 20 to 24 years
In terms of unemployment among ages 20 to 24 years, the demographic groups most similar to Osage are Hmong (9.4%, a difference of 0.010%), Immigrants from Bosnia and Herzegovina (9.4%, a difference of 0.010%), Chinese (9.4%, a difference of 0.13%), Tongan (9.4%, a difference of 0.28%), and Immigrants from Nepal (9.4%, a difference of 0.28%).
| Demographics | Rating | Rank | Unemployment Among Ages 20 to 24 years |
| Immigrants | Congo | 100.0 /100 | #13 | Exceptional 9.2% |
| Slovenes | 100.0 /100 | #14 | Exceptional 9.3% |
| Immigrants | Sudan | 100.0 /100 | #15 | Exceptional 9.3% |
| Danes | 100.0 /100 | #16 | Exceptional 9.3% |
| Czechs | 100.0 /100 | #17 | Exceptional 9.3% |
| Chinese | 100.0 /100 | #18 | Exceptional 9.4% |
| Hmong | 100.0 /100 | #19 | Exceptional 9.4% |
| Osage | 100.0 /100 | #20 | Exceptional 9.4% |
| Immigrants | Bosnia and Herzegovina | 100.0 /100 | #21 | Exceptional 9.4% |
| Tongans | 100.0 /100 | #22 | Exceptional 9.4% |
| Immigrants | Nepal | 100.0 /100 | #23 | Exceptional 9.4% |
| Taiwanese | 100.0 /100 | #24 | Exceptional 9.4% |
| Immigrants | Eritrea | 100.0 /100 | #25 | Exceptional 9.5% |
| Swedes | 100.0 /100 | #26 | Exceptional 9.5% |
| Immigrants | Zimbabwe | 100.0 /100 | #27 | Exceptional 9.5% |