Paraguayan vs Immigrants from Spain Unemployment Among Ages 60 to 64 years

COMPARE

Paraguayan
Race
Ancestry
AfghanAfricanAlaska NativeAlaskan AthabascanAlbanianAleutAlsatianAmericanApacheArabArapahoArgentineanArmenianAssyrian/Chaldean/SyriacAustralianAustrianBahamianBangladeshiBarbadianBasqueBelgianBelizeanBermudanBhutaneseBlackfeetBolivianBrazilianBritishBritish West IndianBulgarianBurmeseCajunCambodianCanadianCape VerdeanCarpatho RusynCelticCentral AmericanCentral American IndianCherokeeCheyenneChickasawChileanChineseChippewaChoctawColombianColvilleComancheCosta RicanCreeCreekCroatianCrowCubanCypriotCzechCzechoslovakianDanishDelawareDominicanDutchDutch West IndianEastern EuropeanEcuadorianEgyptianEnglishEstonianEthiopianEuropeanFijianFilipinoFinnishFrenchFrench American IndianFrench CanadianGermanGerman RussianGhanaianGreekGuamanian/ChamorroGuatemalanGuyaneseHaitianHmongHonduranHopiHoumaHungarianIcelanderIndian (Asian)IndonesianInupiatIranianIraqiIrishIroquoisIsraeliItalianJamaicanJapaneseJordanianKenyanKiowaKoreanLaotianLatvianLebaneseLiberianLithuanianLumbeeLuxembourgerMacedonianMalaysianMalteseMarshalleseMenomineeMexicanMexican American IndianMongolianMoroccanNative HawaiianNavajoNepaleseNew ZealanderNicaraguanNigerianNorthern EuropeanNorwegianOkinawanOsageOttawaPaiutePakistaniPalestinianPanamanianParaguayanPennsylvania GermanPeruvianPimaPolishPortuguesePotawatomiPuebloPuerto RicanPuget Sound SalishRomanianRussianSalvadoranSamoanScandinavianScotch-IrishScottishSeminoleSenegaleseSerbianShoshoneSierra LeoneanSiouxSlavicSlovakSloveneSomaliSouth AfricanSouth AmericanSouth American IndianSoviet UnionSpaniardSpanishSpanish AmericanSpanish American IndianSri LankanSubsaharan AfricanSudaneseSwedishSwissSyrianTaiwaneseThaiTlingit-HaidaTohono O'OdhamTonganTrinidadian and TobagonianTsimshianTurkishU.S. Virgin IslanderUgandanUkrainianUruguayanUteVenezuelanVietnameseWelshWest IndianYakamaYaquiYugoslavianYumanYup'ikZimbabwean
Immigration
NonimmigrantsImmigrantsAfghanistanAfricaAlbaniaArgentinaArmeniaAsiaAustraliaAustriaBahamasBangladeshBarbadosBelarusBelgiumBelizeBoliviaBosnia and HerzegovinaBrazilBulgariaBurma/MyanmarCabo VerdeCambodiaCameroonCanadaCaribbeanCentral AmericaChileChinaColombiaCongoCosta RicaCroatiaCubaCzechoslovakiaDenmarkDominicaDominican RepublicEastern AfricaEastern AsiaEastern EuropeEcuadorEgyptEl SalvadorEnglandEritreaEthiopiaEuropeFijiFranceGermanyGhanaGreeceGrenadaGuatemalaGuyanaHaitiHondurasHong KongHungaryIndiaIndonesiaIranIraqIrelandIsraelItalyJamaicaJapanJordanKazakhstanKenyaKoreaKuwaitLaosLatin AmericaLatviaLebanonLiberiaLithuaniaMalaysiaMexicoMicronesiaMiddle AfricaMoldovaMoroccoNepalNetherlandsNicaraguaNigeriaNorth AmericaNorth MacedoniaNorthern AfricaNorthern EuropeNorwayOceaniaPakistanPanamaPeruPhilippinesPolandPortugalRomaniaRussiaSaudi ArabiaScotlandSenegalSerbiaSierra LeoneSingaporeSomaliaSouth AfricaSouth AmericaSouth Central AsiaSouth Eastern AsiaSouthern EuropeSri LankaSt. Vincent and the GrenadinesSudanSwedenSwitzerlandSyriaTaiwanThailandTrinidad and TobagoTurkeyUgandaUkraineUruguayUzbekistanVenezuelaVietnamWest IndiesWestern AfricaWestern AsiaWestern EuropeYemenZaireZimbabweAzores
Immigrants from Spain
Race
Ancestry
AfghanAfricanAlaska NativeAlaskan AthabascanAlbanianAleutAlsatianAmericanApacheArabArapahoArgentineanArmenianAssyrian/Chaldean/SyriacAustralianAustrianBahamianBangladeshiBarbadianBasqueBelgianBelizeanBermudanBhutaneseBlackfeetBolivianBrazilianBritishBritish West IndianBulgarianBurmeseCajunCambodianCanadianCape VerdeanCarpatho RusynCelticCentral AmericanCentral American IndianCherokeeCheyenneChickasawChileanChineseChippewaChoctawColombianColvilleComancheCosta RicanCreeCreekCroatianCrowCubanCypriotCzechCzechoslovakianDanishDelawareDominicanDutchDutch West IndianEastern EuropeanEcuadorianEgyptianEnglishEstonianEthiopianEuropeanFijianFilipinoFinnishFrenchFrench American IndianFrench CanadianGermanGerman RussianGhanaianGreekGuamanian/ChamorroGuatemalanGuyaneseHaitianHmongHonduranHopiHoumaHungarianIcelanderIndian (Asian)IndonesianInupiatIranianIraqiIrishIroquoisIsraeliItalianJamaicanJapaneseJordanianKenyanKiowaKoreanLaotianLatvianLebaneseLiberianLithuanianLumbeeLuxembourgerMacedonianMalaysianMalteseMarshalleseMenomineeMexicanMexican American IndianMongolianMoroccanNative HawaiianNavajoNepaleseNew ZealanderNicaraguanNigerianNorthern EuropeanNorwegianOkinawanOsageOttawaPaiutePakistaniPalestinianPanamanianPennsylvania GermanPeruvianPimaPolishPortuguesePotawatomiPuebloPuerto RicanPuget Sound SalishRomanianRussianSalvadoranSamoanScandinavianScotch-IrishScottishSeminoleSenegaleseSerbianShoshoneSierra LeoneanSiouxSlavicSlovakSloveneSomaliSouth AfricanSouth AmericanSouth American IndianSoviet UnionSpaniardSpanishSpanish AmericanSpanish American IndianSri LankanSubsaharan AfricanSudaneseSwedishSwissSyrianTaiwaneseThaiTlingit-HaidaTohono O'OdhamTonganTrinidadian and TobagonianTsimshianTurkishU.S. Virgin IslanderUgandanUkrainianUruguayanUteVenezuelanVietnameseWelshWest IndianYakamaYaquiYugoslavianYumanYup'ikZimbabwean
Immigration
NonimmigrantsImmigrantsAfghanistanAfricaAlbaniaArgentinaArmeniaAsiaAustraliaAustriaBahamasBangladeshBarbadosBelarusBelgiumBelizeBoliviaBosnia and HerzegovinaBrazilBulgariaBurma/MyanmarCabo VerdeCambodiaCameroonCanadaCaribbeanCentral AmericaChileChinaColombiaCongoCosta RicaCroatiaCubaCzechoslovakiaDenmarkDominicaDominican RepublicEastern AfricaEastern AsiaEastern EuropeEcuadorEgyptEl SalvadorEnglandEritreaEthiopiaEuropeFijiFranceGermanyGhanaGreeceGrenadaGuatemalaGuyanaHaitiHondurasHong KongHungaryIndiaIndonesiaIranIraqIrelandIsraelItalyJamaicaJapanJordanKazakhstanKenyaKoreaKuwaitLaosLatin AmericaLatviaLebanonLiberiaLithuaniaMalaysiaMexicoMicronesiaMiddle AfricaMoldovaMoroccoNepalNetherlandsNicaraguaNigeriaNorth AmericaNorth MacedoniaNorthern AfricaNorthern EuropeNorwayOceaniaPakistanPanamaPeruPhilippinesPolandPortugalRomaniaRussiaSaudi ArabiaScotlandSenegalSerbiaSierra LeoneSingaporeSomaliaSouth AfricaSouth AmericaSouth Central AsiaSouth Eastern AsiaSouthern EuropeSpainSri LankaSt. Vincent and the GrenadinesSudanSwedenSwitzerlandSyriaTaiwanThailandTrinidad and TobagoTurkeyUgandaUkraineUruguayUzbekistanVenezuelaVietnamWest IndiesWestern AfricaWestern AsiaWestern EuropeYemenZaireZimbabweAzores
Unemployment Among Ages 60 to 64 years
Income
Poverty
Unemployment
Labor Participation
Family Structure
Vehicle Availability
Education Level
Disability

Unemployment Among Ages 60 to 64 years Comparison

Paraguayans

Immigrants from Spain

Exceptional
Tragic
4.7%
UNEMPLOYMENT AMONG AGES 60 TO 64 YEARS
97.7/ 100
METRIC RATING
104th/ 347
METRIC RANK
5.2%
UNEMPLOYMENT AMONG AGES 60 TO 64 YEARS
0.1/ 100
METRIC RATING
273rd/ 347
METRIC RANK

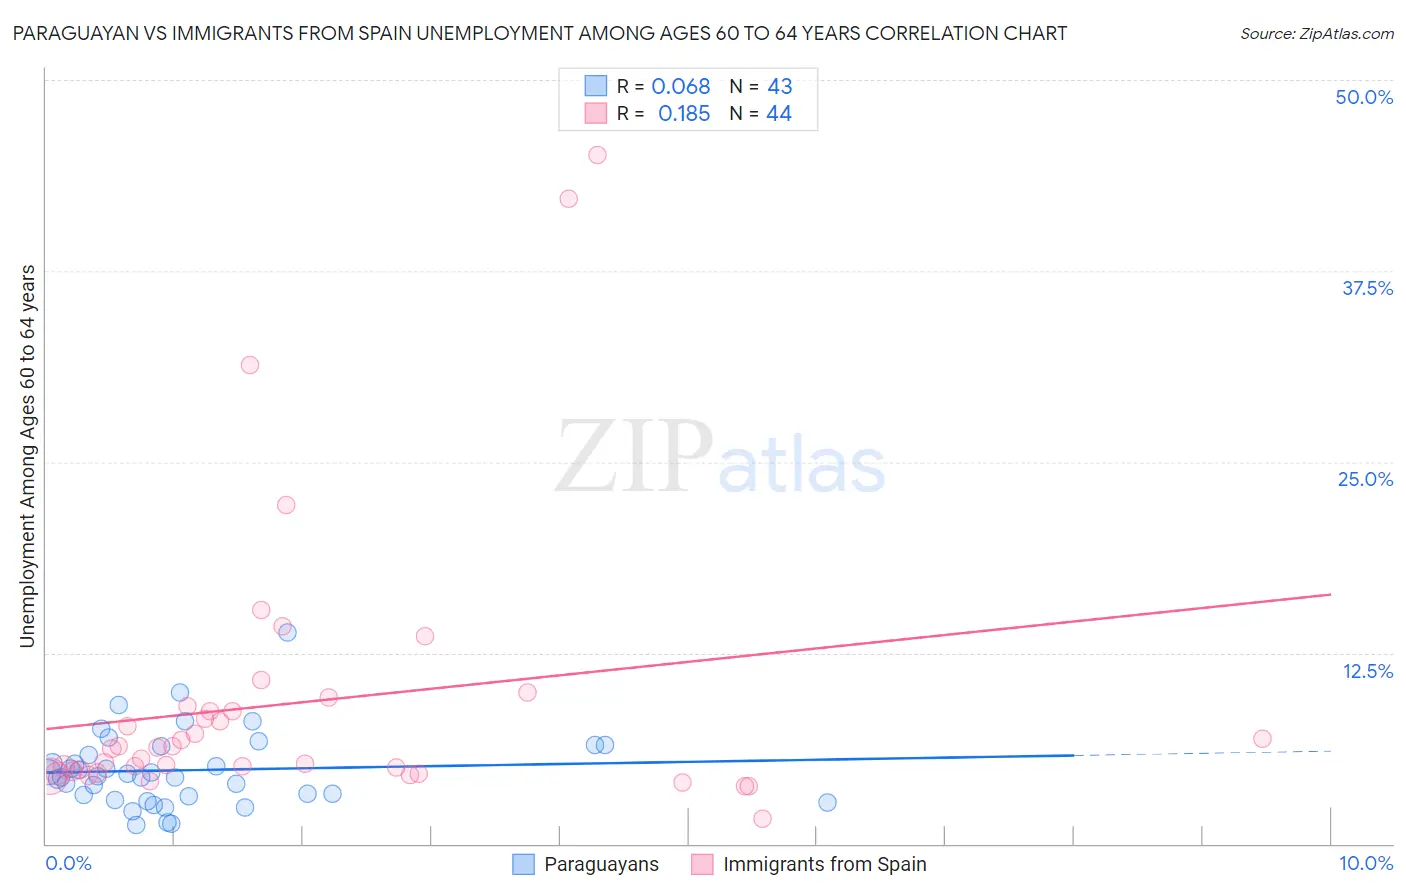
Paraguayan vs Immigrants from Spain Unemployment Among Ages 60 to 64 years Correlation Chart

The statistical analysis conducted on geographies consisting of 92,323,400 people shows a slight positive correlation between the proportion of Paraguayans and unemployment rate among population between the ages 60 and 64 in the United States with a correlation coefficient (R) of 0.068 and weighted average of 4.7%. Similarly, the statistical analysis conducted on geographies consisting of 226,488,675 people shows a poor positive correlation between the proportion of Immigrants from Spain and unemployment rate among population between the ages 60 and 64 in the United States with a correlation coefficient (R) of 0.185 and weighted average of 5.2%, a difference of 10.1%.
Paraguayan vs Immigrants from Spain Unemployment Among Ages 60 to 64 years

Unemployment Among Ages 60 to 64 years Correlation Summary

MeasurementParaguayanImmigrants from Spain
Minimum1.2%1.6%
Maximum13.8%45.1%
Range12.6%43.5%
Mean4.8%9.2%
Median4.4%6.3%
Interquartile 25% (IQ1)3.1%4.7%
Interquartile 75% (IQ3)6.4%8.9%
Interquartile Range (IQR)3.3%4.2%
Standard Deviation (Sample)2.5%9.2%
Standard Deviation (Population)2.4%9.1%

Similar Demographics by Unemployment Among Ages 60 to 64 years

Demographics Similar to Paraguayans by Unemployment Among Ages 60 to 64 years

In terms of unemployment among ages 60 to 64 years, the demographic groups most similar to Paraguayans are Canadian (4.7%, a difference of 0.030%), White/Caucasian (4.7%, a difference of 0.040%), Immigrants from Canada (4.7%, a difference of 0.050%), Malaysian (4.7%, a difference of 0.060%), and Immigrants from North America (4.7%, a difference of 0.060%).
DemographicsRating | RankUnemployment Among Ages 60 to 64 years
Immigrants | Albania
98.0
/100
|
#97
Exceptional
4.7%
Somalis
98.0
/100
|
#98
Exceptional
4.7%
Egyptians
98.0
/100
|
#99
Exceptional
4.7%
Portuguese
97.9
/100
|
#100
Exceptional
4.7%
Malaysians
97.9
/100
|
#101
Exceptional
4.7%
Immigrants | Canada
97.8
/100
|
#102
Exceptional
4.7%
Whites/Caucasians
97.8
/100
|
#103
Exceptional
4.7%
Paraguayans
97.7
/100
|
#104
Exceptional
4.7%
Canadians
97.7
/100
|
#105
Exceptional
4.7%
Immigrants | North America
97.6
/100
|
#106
Exceptional
4.7%
Greeks
97.5
/100
|
#107
Exceptional
4.7%
Immigrants | Japan
97.4
/100
|
#108
Exceptional
4.7%
Immigrants | Netherlands
97.4
/100
|
#109
Exceptional
4.7%
Ethiopians
97.2
/100
|
#110
Exceptional
4.7%
French
97.1
/100
|
#111
Exceptional
4.7%

Demographics Similar to Immigrants from Spain by Unemployment Among Ages 60 to 64 years

In terms of unemployment among ages 60 to 64 years, the demographic groups most similar to Immigrants from Spain are Haitian (5.2%, a difference of 0.070%), Israeli (5.2%, a difference of 0.10%), Hopi (5.2%, a difference of 0.14%), Immigrants from Hong Kong (5.2%, a difference of 0.28%), and Immigrants from Iran (5.1%, a difference of 0.37%).
DemographicsRating | RankUnemployment Among Ages 60 to 64 years
Immigrants | Australia
0.2
/100
|
#266
Tragic
5.1%
Immigrants | Bahamas
0.2
/100
|
#267
Tragic
5.1%
Central American Indians
0.2
/100
|
#268
Tragic
5.1%
Immigrants | Costa Rica
0.2
/100
|
#269
Tragic
5.1%
Immigrants | Iran
0.1
/100
|
#270
Tragic
5.1%
Israelis
0.1
/100
|
#271
Tragic
5.2%
Haitians
0.1
/100
|
#272
Tragic
5.2%
Immigrants | Spain
0.1
/100
|
#273
Tragic
5.2%
Hopi
0.1
/100
|
#274
Tragic
5.2%
Immigrants | Hong Kong
0.1
/100
|
#275
Tragic
5.2%
Central Americans
0.0
/100
|
#276
Tragic
5.2%
Immigrants | Caribbean
0.0
/100
|
#277
Tragic
5.2%
Guatemalans
0.0
/100
|
#278
Tragic
5.2%
Nepalese
0.0
/100
|
#279
Tragic
5.2%
French American Indians
0.0
/100
|
#280
Tragic
5.2%