Panamanian vs Palestinian Unemployment Among Ages 16 to 19 years
COMPARE
Panamanian
Palestinian
Unemployment Among Ages 16 to 19 years
Unemployment Among Ages 16 to 19 years Comparison
Panamanians
Palestinians
18.7%
UNEMPLOYMENT AMONG AGES 16 TO 19 YEARS
0.4/ 100
METRIC RATING
250th/ 347
METRIC RANK
17.0%
UNEMPLOYMENT AMONG AGES 16 TO 19 YEARS
94.6/ 100
METRIC RATING
103rd/ 347
METRIC RANK
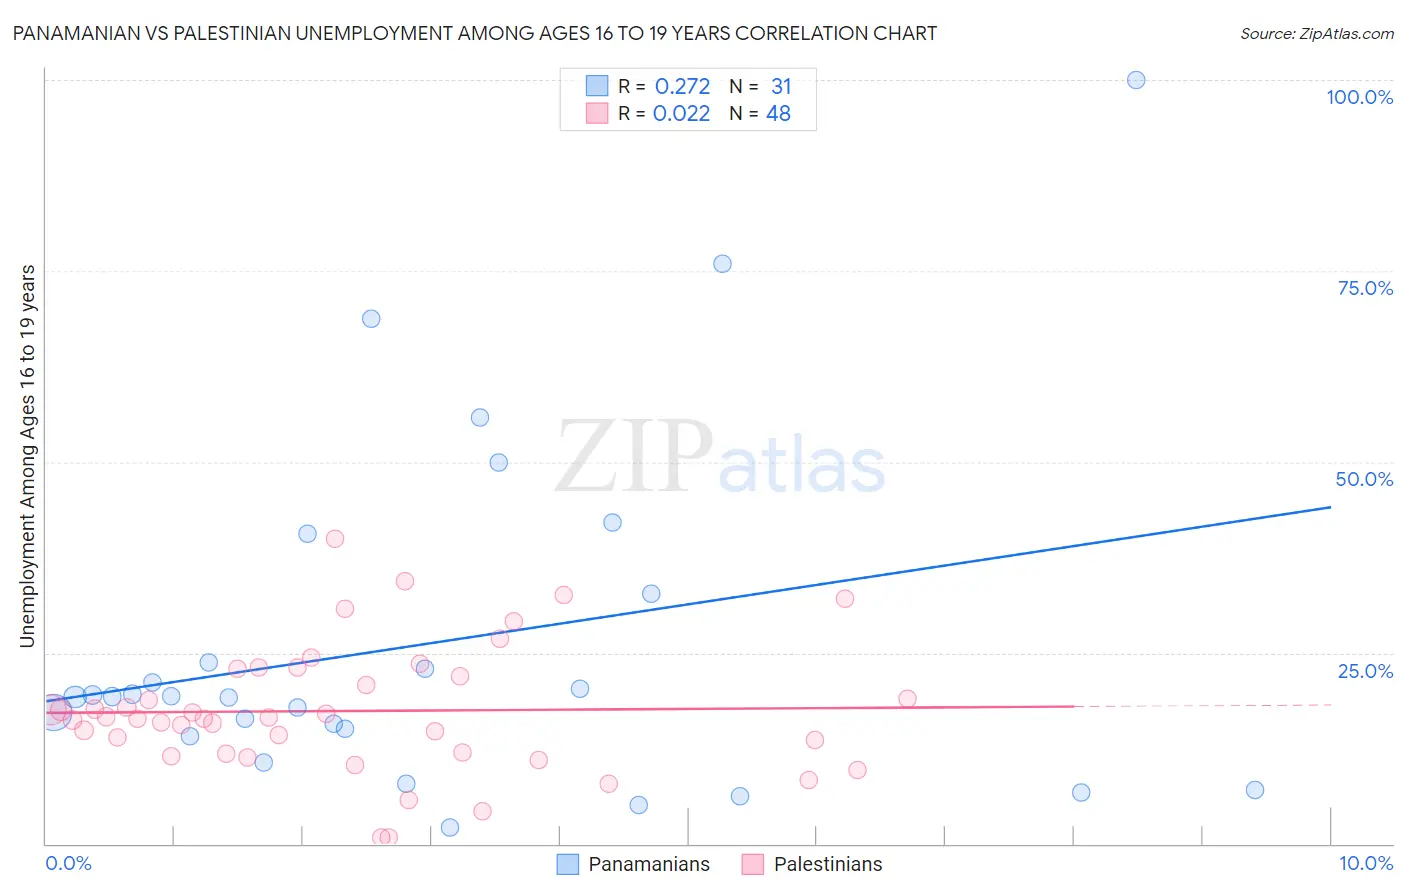
Panamanian vs Palestinian Unemployment Among Ages 16 to 19 years Correlation Chart
The statistical analysis conducted on geographies consisting of 272,796,489 people shows a weak positive correlation between the proportion of Panamanians and unemployment rate among population between the ages 16 and 19 in the United States with a correlation coefficient (R) of 0.272 and weighted average of 18.7%. Similarly, the statistical analysis conducted on geographies consisting of 210,532,956 people shows no correlation between the proportion of Palestinians and unemployment rate among population between the ages 16 and 19 in the United States with a correlation coefficient (R) of 0.022 and weighted average of 17.0%, a difference of 10.2%.
Unemployment Among Ages 16 to 19 years Correlation Summary
| Measurement | Panamanian | Palestinian |
| Minimum | 2.2% | 0.90% |
| Maximum | 100.0% | 40.0% |
| Range | 97.8% | 39.1% |
| Mean | 26.2% | 17.4% |
| Median | 19.3% | 16.5% |
| Interquartile 25% (IQ1) | 14.1% | 11.9% |
| Interquartile 75% (IQ3) | 32.7% | 22.4% |
| Interquartile Range (IQR) | 18.6% | 10.5% |
| Standard Deviation (Sample) | 22.7% | 8.3% |
| Standard Deviation (Population) | 22.3% | 8.2% |
Similar Demographics by Unemployment Among Ages 16 to 19 years
Demographics Similar to Panamanians by Unemployment Among Ages 16 to 19 years
In terms of unemployment among ages 16 to 19 years, the demographic groups most similar to Panamanians are Puget Sound Salish (18.7%, a difference of 0.11%), Subsaharan African (18.7%, a difference of 0.11%), Immigrants from Guatemala (18.7%, a difference of 0.13%), Delaware (18.7%, a difference of 0.17%), and Immigrants from Israel (18.7%, a difference of 0.20%).
| Demographics | Rating | Rank | Unemployment Among Ages 16 to 19 years |
| Mexicans | 0.9 /100 | #243 | Tragic 18.5% |
| Guatemalans | 0.8 /100 | #244 | Tragic 18.6% |
| Immigrants | Belarus | 0.8 /100 | #245 | Tragic 18.6% |
| Immigrants | South America | 0.5 /100 | #246 | Tragic 18.7% |
| Immigrants | Israel | 0.5 /100 | #247 | Tragic 18.7% |
| Delaware | 0.5 /100 | #248 | Tragic 18.7% |
| Puget Sound Salish | 0.5 /100 | #249 | Tragic 18.7% |
| Panamanians | 0.4 /100 | #250 | Tragic 18.7% |
| Sub-Saharan Africans | 0.4 /100 | #251 | Tragic 18.7% |
| Immigrants | Guatemala | 0.4 /100 | #252 | Tragic 18.7% |
| Central Americans | 0.3 /100 | #253 | Tragic 18.8% |
| Apache | 0.3 /100 | #254 | Tragic 18.8% |
| Immigrants | Cameroon | 0.3 /100 | #255 | Tragic 18.8% |
| Mexican American Indians | 0.3 /100 | #256 | Tragic 18.8% |
| Immigrants | Nigeria | 0.2 /100 | #257 | Tragic 18.9% |
Demographics Similar to Palestinians by Unemployment Among Ages 16 to 19 years
In terms of unemployment among ages 16 to 19 years, the demographic groups most similar to Palestinians are Italian (17.0%, a difference of 0.0%), Immigrants from Pakistan (17.0%, a difference of 0.010%), Immigrants from Saudi Arabia (17.0%, a difference of 0.030%), Immigrants from Thailand (17.0%, a difference of 0.040%), and Immigrants from Bulgaria (17.0%, a difference of 0.050%).
| Demographics | Rating | Rank | Unemployment Among Ages 16 to 19 years |
| Ottawa | 95.4 /100 | #96 | Exceptional 16.9% |
| Immigrants | Venezuela | 95.3 /100 | #97 | Exceptional 16.9% |
| Burmese | 95.0 /100 | #98 | Exceptional 17.0% |
| Immigrants | Lithuania | 94.9 /100 | #99 | Exceptional 17.0% |
| Immigrants | Thailand | 94.7 /100 | #100 | Exceptional 17.0% |
| Immigrants | Saudi Arabia | 94.7 /100 | #101 | Exceptional 17.0% |
| Immigrants | Pakistan | 94.6 /100 | #102 | Exceptional 17.0% |
| Palestinians | 94.6 /100 | #103 | Exceptional 17.0% |
| Italians | 94.5 /100 | #104 | Exceptional 17.0% |
| Immigrants | Bulgaria | 94.3 /100 | #105 | Exceptional 17.0% |
| Estonians | 94.3 /100 | #106 | Exceptional 17.0% |
| Immigrants | Brazil | 94.2 /100 | #107 | Exceptional 17.0% |
| Malaysians | 94.2 /100 | #108 | Exceptional 17.0% |
| Iranians | 94.1 /100 | #109 | Exceptional 17.0% |
| Immigrants | Netherlands | 93.9 /100 | #110 | Exceptional 17.0% |