Pakistani vs Salvadoran Unemployment Among Seniors over 65 years
COMPARE
Pakistani
Salvadoran
Unemployment Among Seniors over 65 years
Unemployment Among Seniors over 65 years Comparison
Pakistanis
Salvadorans
5.1%
UNEMPLOYMENT AMONG SENIORS OVER 65 YEARS
75.5/ 100
METRIC RATING
151st/ 347
METRIC RANK
5.6%
UNEMPLOYMENT AMONG SENIORS OVER 65 YEARS
0.0/ 100
METRIC RATING
310th/ 347
METRIC RANK
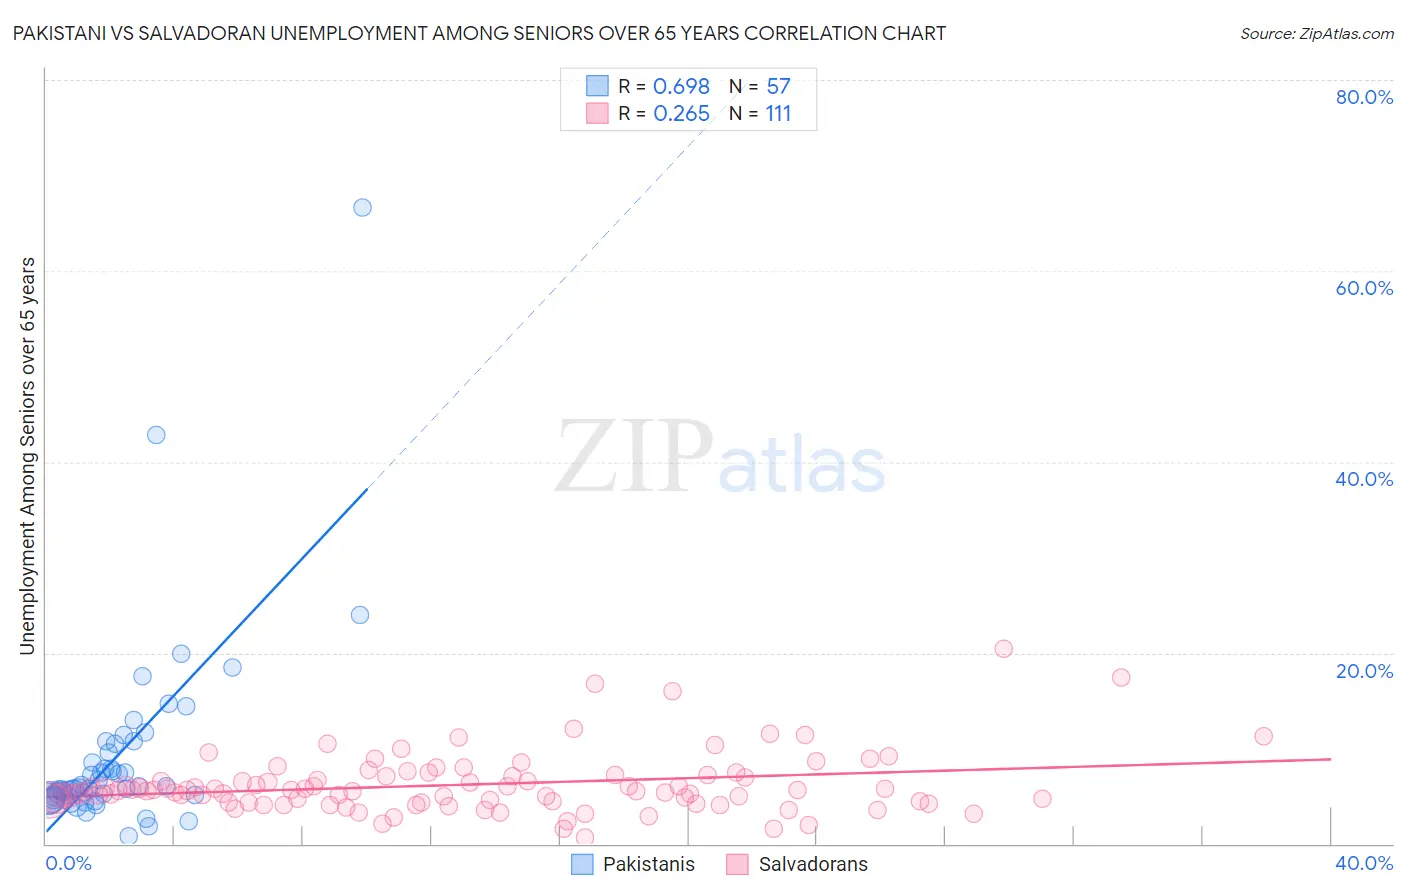
Pakistani vs Salvadoran Unemployment Among Seniors over 65 years Correlation Chart
The statistical analysis conducted on geographies consisting of 309,020,575 people shows a significant positive correlation between the proportion of Pakistanis and unemployment rate amomg seniors over the age of 65 in the United States with a correlation coefficient (R) of 0.698 and weighted average of 5.1%. Similarly, the statistical analysis conducted on geographies consisting of 359,194,343 people shows a weak positive correlation between the proportion of Salvadorans and unemployment rate amomg seniors over the age of 65 in the United States with a correlation coefficient (R) of 0.265 and weighted average of 5.6%, a difference of 10.3%.
Unemployment Among Seniors over 65 years Correlation Summary
| Measurement | Pakistani | Salvadoran |
| Minimum | 0.80% | 0.60% |
| Maximum | 66.6% | 20.4% |
| Range | 65.8% | 19.8% |
| Mean | 9.1% | 6.2% |
| Median | 5.8% | 5.6% |
| Interquartile 25% (IQ1) | 4.8% | 4.3% |
| Interquartile 75% (IQ3) | 10.0% | 7.1% |
| Interquartile Range (IQR) | 5.2% | 2.7% |
| Standard Deviation (Sample) | 10.1% | 3.2% |
| Standard Deviation (Population) | 10.0% | 3.1% |
Similar Demographics by Unemployment Among Seniors over 65 years
Demographics Similar to Pakistanis by Unemployment Among Seniors over 65 years
In terms of unemployment among seniors over 65 years, the demographic groups most similar to Pakistanis are Immigrants from Asia (5.1%, a difference of 0.0%), Canadian (5.1%, a difference of 0.030%), Immigrants from Czechoslovakia (5.1%, a difference of 0.040%), Immigrants from Afghanistan (5.1%, a difference of 0.060%), and Immigrants from Hong Kong (5.1%, a difference of 0.060%).
| Demographics | Rating | Rank | Unemployment Among Seniors over 65 years |
| Poles | 80.3 /100 | #144 | Excellent 5.1% |
| Spanish | 78.8 /100 | #145 | Good 5.1% |
| Immigrants | Russia | 78.5 /100 | #146 | Good 5.1% |
| Slovaks | 77.9 /100 | #147 | Good 5.1% |
| Greeks | 77.0 /100 | #148 | Good 5.1% |
| Immigrants | Afghanistan | 76.8 /100 | #149 | Good 5.1% |
| Immigrants | Asia | 75.6 /100 | #150 | Good 5.1% |
| Pakistanis | 75.5 /100 | #151 | Good 5.1% |
| Canadians | 74.7 /100 | #152 | Good 5.1% |
| Immigrants | Czechoslovakia | 74.5 /100 | #153 | Good 5.1% |
| Immigrants | Hong Kong | 74.0 /100 | #154 | Good 5.1% |
| Basques | 72.9 /100 | #155 | Good 5.1% |
| Immigrants | Romania | 72.4 /100 | #156 | Good 5.1% |
| Immigrants | Northern Europe | 69.8 /100 | #157 | Good 5.1% |
| Immigrants | Belarus | 69.0 /100 | #158 | Good 5.1% |
Demographics Similar to Salvadorans by Unemployment Among Seniors over 65 years
In terms of unemployment among seniors over 65 years, the demographic groups most similar to Salvadorans are Immigrants from Guatemala (5.6%, a difference of 0.040%), Immigrants from Guyana (5.6%, a difference of 0.14%), Immigrants from St. Vincent and the Grenadines (5.6%, a difference of 0.26%), Immigrants from Ecuador (5.6%, a difference of 0.27%), and Barbadian (5.6%, a difference of 0.30%).
| Demographics | Rating | Rank | Unemployment Among Seniors over 65 years |
| Immigrants | Latin America | 0.0 /100 | #303 | Tragic 5.6% |
| Liberians | 0.0 /100 | #304 | Tragic 5.6% |
| Mexicans | 0.0 /100 | #305 | Tragic 5.6% |
| Ecuadorians | 0.0 /100 | #306 | Tragic 5.6% |
| Portuguese | 0.0 /100 | #307 | Tragic 5.6% |
| Immigrants | St. Vincent and the Grenadines | 0.0 /100 | #308 | Tragic 5.6% |
| Immigrants | Guatemala | 0.0 /100 | #309 | Tragic 5.6% |
| Salvadorans | 0.0 /100 | #310 | Tragic 5.6% |
| Immigrants | Guyana | 0.0 /100 | #311 | Tragic 5.6% |
| Immigrants | Ecuador | 0.0 /100 | #312 | Tragic 5.6% |
| Barbadians | 0.0 /100 | #313 | Tragic 5.6% |
| Delaware | 0.0 /100 | #314 | Tragic 5.7% |
| Immigrants | El Salvador | 0.0 /100 | #315 | Tragic 5.7% |
| Immigrants | Central America | 0.0 /100 | #316 | Tragic 5.7% |
| Immigrants | Bahamas | 0.0 /100 | #317 | Tragic 5.7% |