Paiute vs Immigrants from Ethiopia Unemployment Among Ages 55 to 59 years

COMPARE

Paiute
Race
Ancestry
AfghanAfricanAlaska NativeAlaskan AthabascanAlbanianAleutAlsatianAmericanApacheArabArapahoArgentineanArmenianAssyrian/Chaldean/SyriacAustralianAustrianBahamianBangladeshiBarbadianBasqueBelgianBelizeanBermudanBhutaneseBlackfeetBolivianBrazilianBritishBritish West IndianBulgarianBurmeseCajunCambodianCanadianCape VerdeanCarpatho RusynCelticCentral AmericanCentral American IndianCherokeeCheyenneChickasawChileanChineseChippewaChoctawColombianColvilleComancheCosta RicanCreeCreekCroatianCrowCubanCypriotCzechCzechoslovakianDanishDelawareDominicanDutchDutch West IndianEastern EuropeanEcuadorianEgyptianEnglishEstonianEthiopianEuropeanFijianFilipinoFinnishFrenchFrench American IndianFrench CanadianGermanGerman RussianGhanaianGreekGuamanian/ChamorroGuatemalanGuyaneseHaitianHmongHonduranHopiHoumaHungarianIcelanderIndian (Asian)IndonesianInupiatIranianIraqiIrishIroquoisIsraeliItalianJamaicanJapaneseJordanianKenyanKiowaKoreanLaotianLatvianLebaneseLiberianLithuanianLumbeeLuxembourgerMacedonianMalaysianMalteseMarshalleseMenomineeMexicanMexican American IndianMongolianMoroccanNative HawaiianNavajoNepaleseNew ZealanderNicaraguanNigerianNorthern EuropeanNorwegianOkinawanOsageOttawaPaiutePakistaniPalestinianPanamanianParaguayanPennsylvania GermanPeruvianPimaPolishPortuguesePotawatomiPuebloPuerto RicanPuget Sound SalishRomanianRussianSalvadoranSamoanScandinavianScotch-IrishScottishSeminoleSenegaleseSerbianShoshoneSierra LeoneanSiouxSlavicSlovakSloveneSomaliSouth AfricanSouth AmericanSouth American IndianSoviet UnionSpaniardSpanishSpanish AmericanSpanish American IndianSri LankanSubsaharan AfricanSudaneseSwedishSwissSyrianTaiwaneseThaiTlingit-HaidaTohono O'OdhamTonganTrinidadian and TobagonianTsimshianTurkishU.S. Virgin IslanderUgandanUkrainianUruguayanUteVenezuelanVietnameseWelshWest IndianYakamaYaquiYugoslavianYumanYup'ikZimbabwean
Immigration
NonimmigrantsImmigrantsAfghanistanAfricaAlbaniaArgentinaArmeniaAsiaAustraliaAustriaBahamasBangladeshBarbadosBelarusBelgiumBelizeBoliviaBosnia and HerzegovinaBrazilBulgariaBurma/MyanmarCabo VerdeCambodiaCameroonCanadaCaribbeanCentral AmericaChileChinaColombiaCongoCosta RicaCroatiaCubaCzechoslovakiaDenmarkDominicaDominican RepublicEastern AfricaEastern AsiaEastern EuropeEcuadorEgyptEl SalvadorEnglandEritreaEuropeFijiFranceGermanyGhanaGreeceGrenadaGuatemalaGuyanaHaitiHondurasHong KongHungaryIndiaIndonesiaIranIraqIrelandIsraelItalyJamaicaJapanJordanKazakhstanKenyaKoreaKuwaitLaosLatin AmericaLatviaLebanonLiberiaLithuaniaMalaysiaMexicoMicronesiaMiddle AfricaMoldovaMoroccoNepalNetherlandsNicaraguaNigeriaNorth AmericaNorth MacedoniaNorthern AfricaNorthern EuropeNorwayOceaniaPakistanPanamaPeruPhilippinesPolandPortugalRomaniaRussiaSaudi ArabiaScotlandSenegalSerbiaSierra LeoneSingaporeSomaliaSouth AfricaSouth AmericaSouth Central AsiaSouth Eastern AsiaSouthern EuropeSpainSri LankaSt. Vincent and the GrenadinesSudanSwedenSwitzerlandSyriaTaiwanThailandTrinidad and TobagoTurkeyUgandaUkraineUruguayUzbekistanVenezuelaVietnamWest IndiesWestern AfricaWestern AsiaWestern EuropeYemenZaireZimbabweAzores
Immigrants from Ethiopia
Race
Ancestry
AfghanAfricanAlaska NativeAlaskan AthabascanAlbanianAleutAlsatianAmericanApacheArabArapahoArgentineanArmenianAssyrian/Chaldean/SyriacAustralianAustrianBahamianBangladeshiBarbadianBasqueBelgianBelizeanBermudanBhutaneseBlackfeetBolivianBrazilianBritishBritish West IndianBulgarianBurmeseCajunCambodianCanadianCape VerdeanCarpatho RusynCelticCentral AmericanCentral American IndianCherokeeCheyenneChickasawChileanChineseChippewaChoctawColombianColvilleComancheCosta RicanCreeCreekCroatianCrowCubanCypriotCzechCzechoslovakianDanishDelawareDominicanDutchDutch West IndianEastern EuropeanEcuadorianEgyptianEnglishEstonianEthiopianEuropeanFijianFilipinoFinnishFrenchFrench American IndianFrench CanadianGermanGerman RussianGhanaianGreekGuamanian/ChamorroGuatemalanGuyaneseHaitianHmongHonduranHopiHoumaHungarianIcelanderIndian (Asian)IndonesianInupiatIranianIraqiIrishIroquoisIsraeliItalianJamaicanJapaneseJordanianKenyanKiowaKoreanLaotianLatvianLebaneseLiberianLithuanianLumbeeLuxembourgerMacedonianMalaysianMalteseMarshalleseMenomineeMexicanMexican American IndianMongolianMoroccanNative HawaiianNavajoNepaleseNew ZealanderNicaraguanNigerianNorthern EuropeanNorwegianOkinawanOsageOttawaPakistaniPalestinianPanamanianParaguayanPennsylvania GermanPeruvianPimaPolishPortuguesePotawatomiPuebloPuerto RicanPuget Sound SalishRomanianRussianSalvadoranSamoanScandinavianScotch-IrishScottishSeminoleSenegaleseSerbianShoshoneSierra LeoneanSiouxSlavicSlovakSloveneSomaliSouth AfricanSouth AmericanSouth American IndianSoviet UnionSpaniardSpanishSpanish AmericanSpanish American IndianSri LankanSubsaharan AfricanSudaneseSwedishSwissSyrianTaiwaneseThaiTlingit-HaidaTohono O'OdhamTonganTrinidadian and TobagonianTsimshianTurkishU.S. Virgin IslanderUgandanUkrainianUruguayanUteVenezuelanVietnameseWelshWest IndianYakamaYaquiYugoslavianYumanYup'ikZimbabwean
Immigration
NonimmigrantsImmigrantsAfghanistanAfricaAlbaniaArgentinaArmeniaAsiaAustraliaAustriaBahamasBangladeshBarbadosBelarusBelgiumBelizeBoliviaBosnia and HerzegovinaBrazilBulgariaBurma/MyanmarCabo VerdeCambodiaCameroonCanadaCaribbeanCentral AmericaChileChinaColombiaCongoCosta RicaCroatiaCubaCzechoslovakiaDenmarkDominicaDominican RepublicEastern AfricaEastern AsiaEastern EuropeEcuadorEgyptEl SalvadorEnglandEritreaEthiopiaEuropeFijiFranceGermanyGhanaGreeceGrenadaGuatemalaGuyanaHaitiHondurasHong KongHungaryIndiaIndonesiaIranIraqIrelandIsraelItalyJamaicaJapanJordanKazakhstanKenyaKoreaKuwaitLaosLatin AmericaLatviaLebanonLiberiaLithuaniaMalaysiaMexicoMicronesiaMiddle AfricaMoldovaMoroccoNepalNetherlandsNicaraguaNigeriaNorth AmericaNorth MacedoniaNorthern AfricaNorthern EuropeNorwayOceaniaPakistanPanamaPeruPhilippinesPolandPortugalRomaniaRussiaSaudi ArabiaScotlandSenegalSerbiaSierra LeoneSingaporeSomaliaSouth AfricaSouth AmericaSouth Central AsiaSouth Eastern AsiaSouthern EuropeSpainSri LankaSt. Vincent and the GrenadinesSudanSwedenSwitzerlandSyriaTaiwanThailandTrinidad and TobagoTurkeyUgandaUkraineUruguayUzbekistanVenezuelaVietnamWest IndiesWestern AfricaWestern AsiaWestern EuropeYemenZaireZimbabweAzores
Unemployment Among Ages 55 to 59 years
Income
Poverty
Unemployment
Labor Participation
Family Structure
Vehicle Availability
Education Level
Disability

Unemployment Among Ages 55 to 59 years Comparison

Paiute

Immigrants from Ethiopia

Tragic
Exceptional
6.8%
UNEMPLOYMENT AMONG AGES 55 TO 59 YEARS
0.0/ 100
METRIC RATING
337th/ 347
METRIC RANK
4.5%
UNEMPLOYMENT AMONG AGES 55 TO 59 YEARS
99.9/ 100
METRIC RATING
32nd/ 347
METRIC RANK

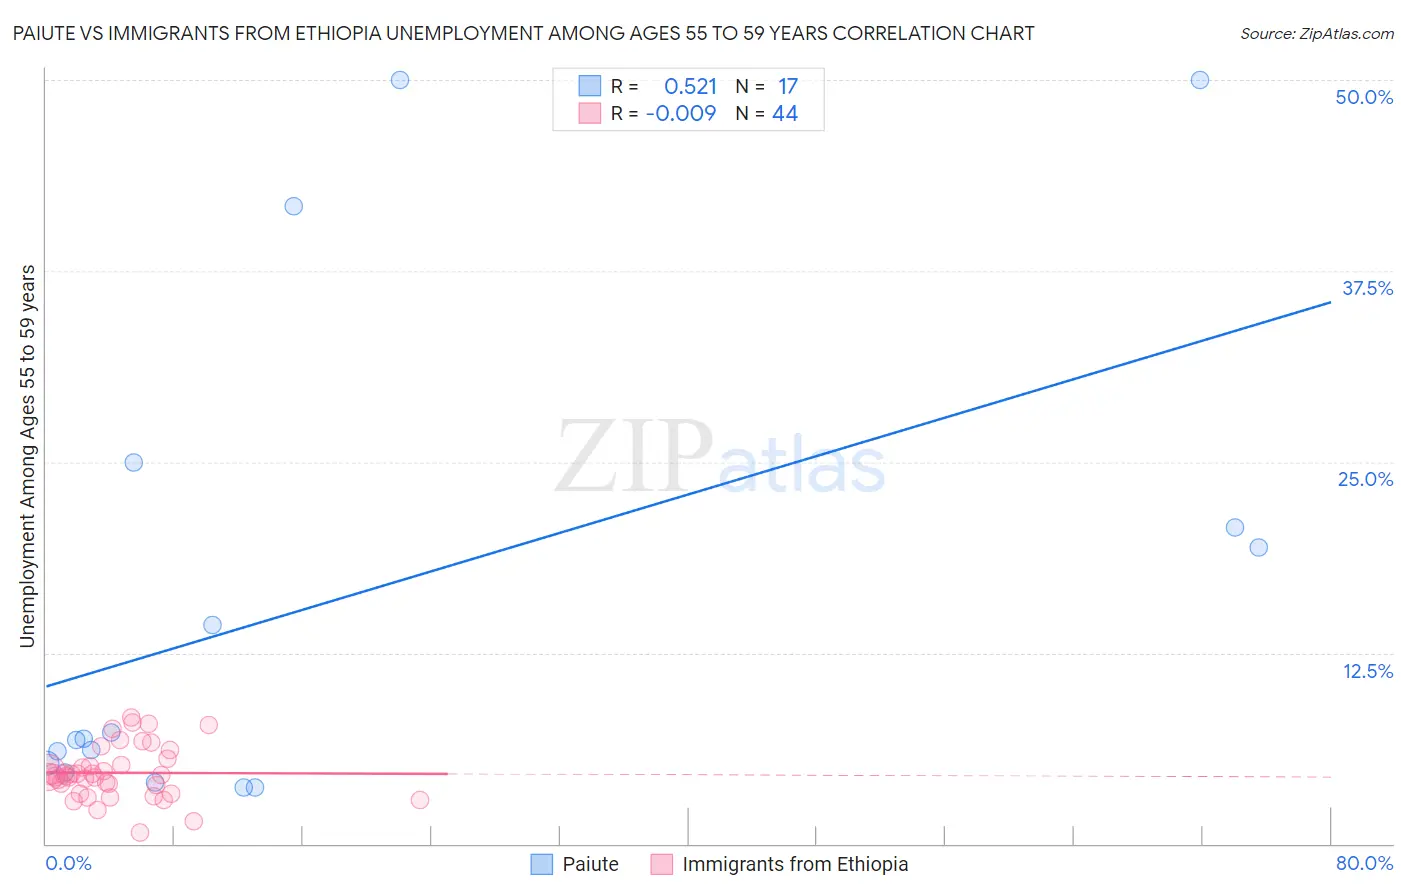
Paiute vs Immigrants from Ethiopia Unemployment Among Ages 55 to 59 years Correlation Chart

The statistical analysis conducted on geographies consisting of 57,126,693 people shows a substantial positive correlation between the proportion of Paiute and unemployment rate among population between the ages 55 and 59 in the United States with a correlation coefficient (R) of 0.521 and weighted average of 6.8%. Similarly, the statistical analysis conducted on geographies consisting of 203,187,895 people shows no correlation between the proportion of Immigrants from Ethiopia and unemployment rate among population between the ages 55 and 59 in the United States with a correlation coefficient (R) of -0.009 and weighted average of 4.5%, a difference of 51.3%.
Paiute vs Immigrants from Ethiopia Unemployment Among Ages 55 to 59 years

Unemployment Among Ages 55 to 59 years Correlation Summary

MeasurementPaiuteImmigrants from Ethiopia
Minimum3.7%0.73%
Maximum50.0%8.3%
Range46.3%7.6%
Mean16.2%4.7%
Median6.9%4.5%
Interquartile 25% (IQ1)5.0%3.6%
Interquartile 75% (IQ3)22.9%5.4%
Interquartile Range (IQR)17.9%1.8%
Standard Deviation (Sample)16.2%1.7%
Standard Deviation (Population)15.8%1.7%

Similar Demographics by Unemployment Among Ages 55 to 59 years

Demographics Similar to Paiute by Unemployment Among Ages 55 to 59 years

In terms of unemployment among ages 55 to 59 years, the demographic groups most similar to Paiute are Navajo (6.7%, a difference of 0.52%), Colville (6.7%, a difference of 0.67%), Pueblo (6.7%, a difference of 0.85%), Immigrants from Yemen (6.9%, a difference of 1.9%), and Pima (6.6%, a difference of 2.1%).
DemographicsRating | RankUnemployment Among Ages 55 to 59 years
Alaska Natives
0.0
/100
|
#330
Tragic
6.2%
Immigrants | Dominican Republic
0.0
/100
|
#331
Tragic
6.3%
Aleuts
0.0
/100
|
#332
Tragic
6.4%
Pima
0.0
/100
|
#333
Tragic
6.6%
Pueblo
0.0
/100
|
#334
Tragic
6.7%
Colville
0.0
/100
|
#335
Tragic
6.7%
Navajo
0.0
/100
|
#336
Tragic
6.7%
Paiute
0.0
/100
|
#337
Tragic
6.8%
Immigrants | Yemen
0.0
/100
|
#338
Tragic
6.9%
Puerto Ricans
0.0
/100
|
#339
Tragic
7.0%
Alaskan Athabascans
0.0
/100
|
#340
Tragic
7.1%
Shoshone
0.0
/100
|
#341
Tragic
7.4%
Hopi
0.0
/100
|
#342
Tragic
8.1%
Yakama
0.0
/100
|
#343
Tragic
8.9%
Inupiat
0.0
/100
|
#344
Tragic
9.0%

Demographics Similar to Immigrants from Ethiopia by Unemployment Among Ages 55 to 59 years

In terms of unemployment among ages 55 to 59 years, the demographic groups most similar to Immigrants from Ethiopia are Belgian (4.5%, a difference of 0.12%), German (4.5%, a difference of 0.13%), Immigrants from Kenya (4.5%, a difference of 0.20%), Thai (4.5%, a difference of 0.20%), and Cypriot (4.5%, a difference of 0.21%).
DemographicsRating | RankUnemployment Among Ages 55 to 59 years
Immigrants | Eritrea
100.0
/100
|
#25
Exceptional
4.4%
Scandinavians
99.9
/100
|
#26
Exceptional
4.5%
Immigrants | Zimbabwe
99.9
/100
|
#27
Exceptional
4.5%
Immigrants | Eastern Africa
99.9
/100
|
#28
Exceptional
4.5%
Palestinians
99.9
/100
|
#29
Exceptional
4.5%
Immigrants | Kenya
99.9
/100
|
#30
Exceptional
4.5%
Germans
99.9
/100
|
#31
Exceptional
4.5%
Immigrants | Ethiopia
99.9
/100
|
#32
Exceptional
4.5%
Belgians
99.9
/100
|
#33
Exceptional
4.5%
Thais
99.9
/100
|
#34
Exceptional
4.5%
Cypriots
99.9
/100
|
#35
Exceptional
4.5%
Ethiopians
99.9
/100
|
#36
Exceptional
4.5%
Immigrants | Bulgaria
99.9
/100
|
#37
Exceptional
4.5%
Assyrians/Chaldeans/Syriacs
99.9
/100
|
#38
Exceptional
4.5%
English
99.9
/100
|
#39
Exceptional
4.5%